
- PREMIUM
- LIVE QUOTES
- INSTITUTIONS
 Index Options
 State Street
 CME Group
 Nasdaq
 Cboe
Cboe TradingView
 Wall Street Journal
Does Progressive Still Offer Upside After Big Multi Year Share Price Gains?
- Many investors are asking whether Progressive at around $227 a share is still a smart buy or if the market has already priced in the upside. This is exactly the kind of setup where valuation analysis becomes especially important.
- The stock has slipped about 0.9% over the last week, but that comes after an 11.5% jump over the past month and gains of 79.3% in 3 years and 167.8% in 5 years. It is still down 5.6% year to date and 11.0% over the last 12 months.
- Recently, investors have been digesting headlines around pricing shifts in the auto insurance market and competitive pressure from peers, which can quickly reshape expectations for future profitability and growth. There has also been ongoing focus on how insurers like Progressive are managing claim costs and underwriting standards, both of which feed directly into how the market values the stock.
- In our framework, Progressive scores a 3/6 valuation check. This suggests some metrics hint at undervaluation while others look more fully priced. Below we walk through the main valuation approaches the market uses, followed by a more holistic way to think about what the stock may be worth.
Find out why Progressive's -11.0% return over the last year is lagging behind its peers.
Approach 1: Progressive Excess Returns Analysis
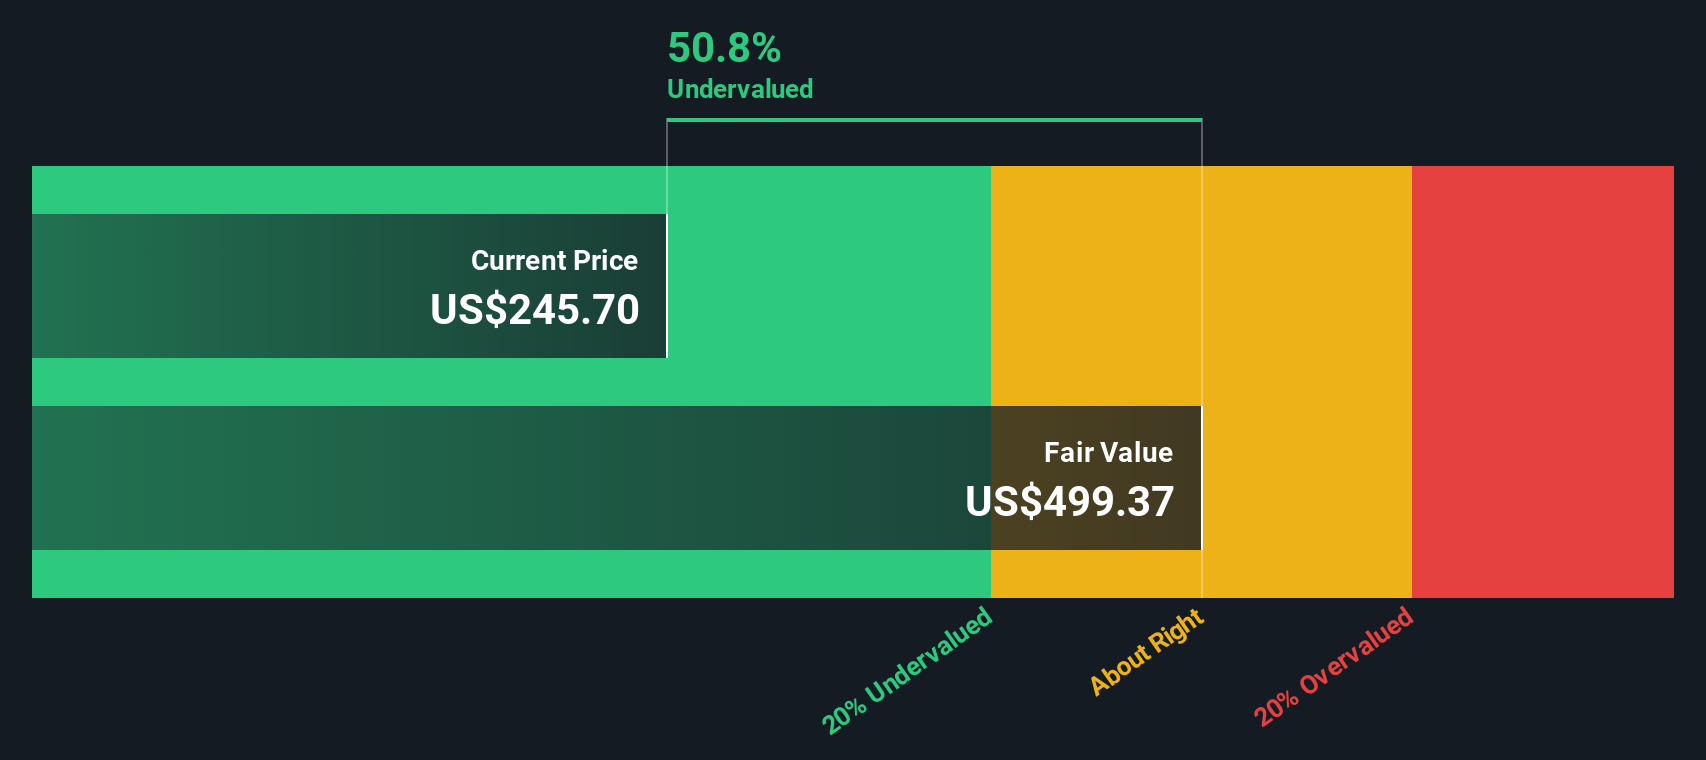
The Excess Returns model looks at how much profit Progressive can generate above the return that shareholders reasonably require, and then builds an intrinsic value from those surplus profits.
For Progressive, the starting point is its capital base. The company has a Book Value of $60.49 per share and a Stable Book Value estimate of $71.82 per share, based on forecasts from 11 analysts. On that equity base, Progressive is expected to earn Stable EPS of $20.29 per share, drawn from weighted future Return on Equity estimates from 12 analysts. That implies an Average Return on Equity of 28.25%, which is above the estimated Cost of Equity of $5.00 per share.
The gap between what shareholders require and what Progressive is expected to earn results in an Excess Return of $15.29 per share. When these excess returns are projected forward and discounted, the model arrives at an intrinsic value of about $485.58 per share. Compared with the current share price around $227, the Excess Returns framework indicates the stock is roughly 53.2% undervalued.
Result: UNDERVALUED
Our Excess Returns analysis suggests Progressive is undervalued by 53.2%. Track this in your watchlist or portfolio, or discover 917 more undervalued stocks based on cash flows.
Approach 2: Progressive Price vs Earnings
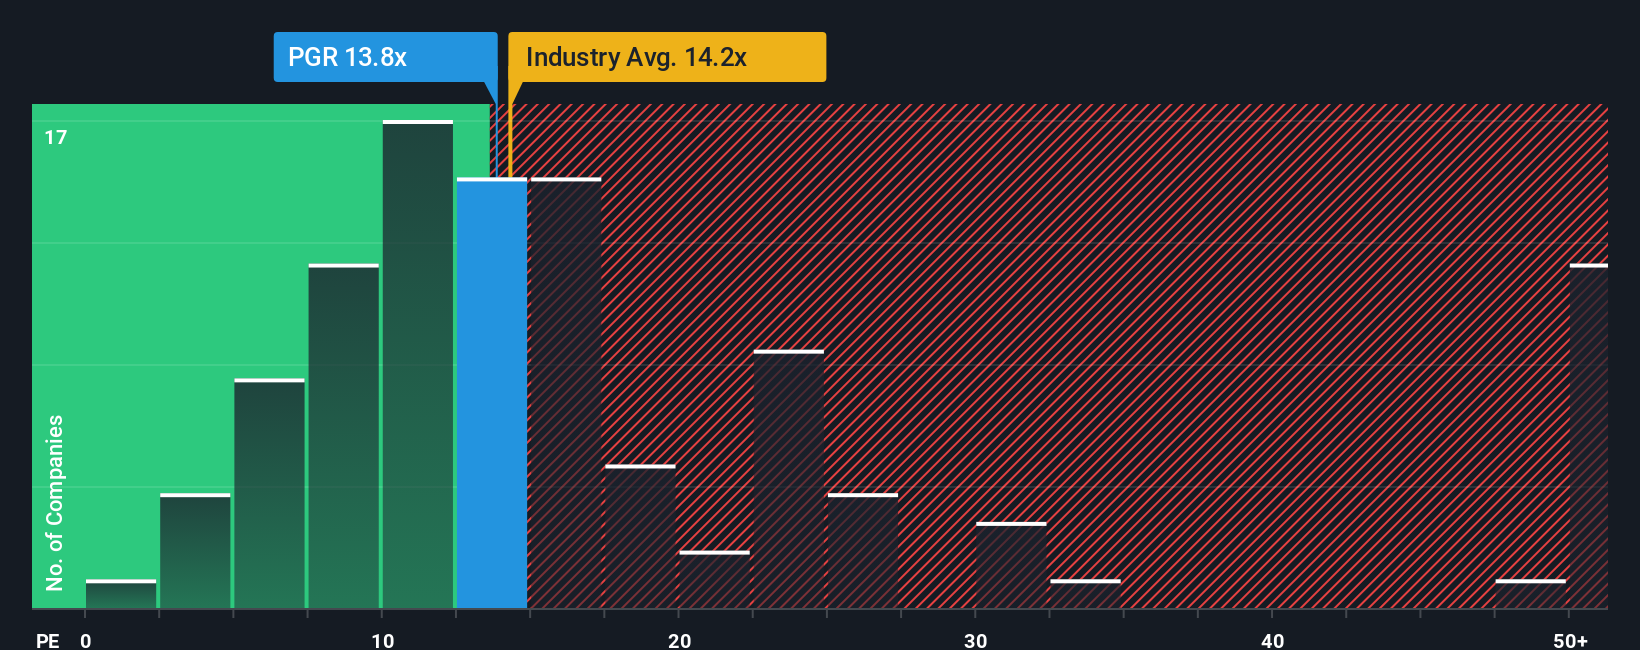
For a consistently profitable insurer like Progressive, the price to earnings, or PE, ratio is a natural way to gauge value because it ties the share price directly to the earnings power that ultimately funds dividends and growth. In general, higher growth prospects and lower perceived risk justify a higher PE, while slower or more uncertain growth tends to pull a fair multiple down.
Progressive currently trades on a PE of 12.44x. That is slightly below the broader insurance industry average of about 12.95x, but above the 9.43x average of its closest peers. Simply Wall St also calculates a Fair Ratio of 11.97x for Progressive, a proprietary PE benchmark that incorporates the company’s earnings growth outlook, profit margins, risk profile, industry and market capitalization. This tailored yardstick is more informative than simple peer or industry comparisons because it adjusts for Progressive’s specific strengths and vulnerabilities.
Comparing the current PE of 12.44x with the Fair Ratio of 11.97x suggests the market is asking only a small premium to what looks reasonable for Progressive’s fundamentals.
Result: ABOUT RIGHT
PE ratios tell one story, but what if the real opportunity lies elsewhere? Discover 1443 companies where insiders are betting big on explosive growth.
Upgrade Your Decision Making: Choose your Progressive Narrative
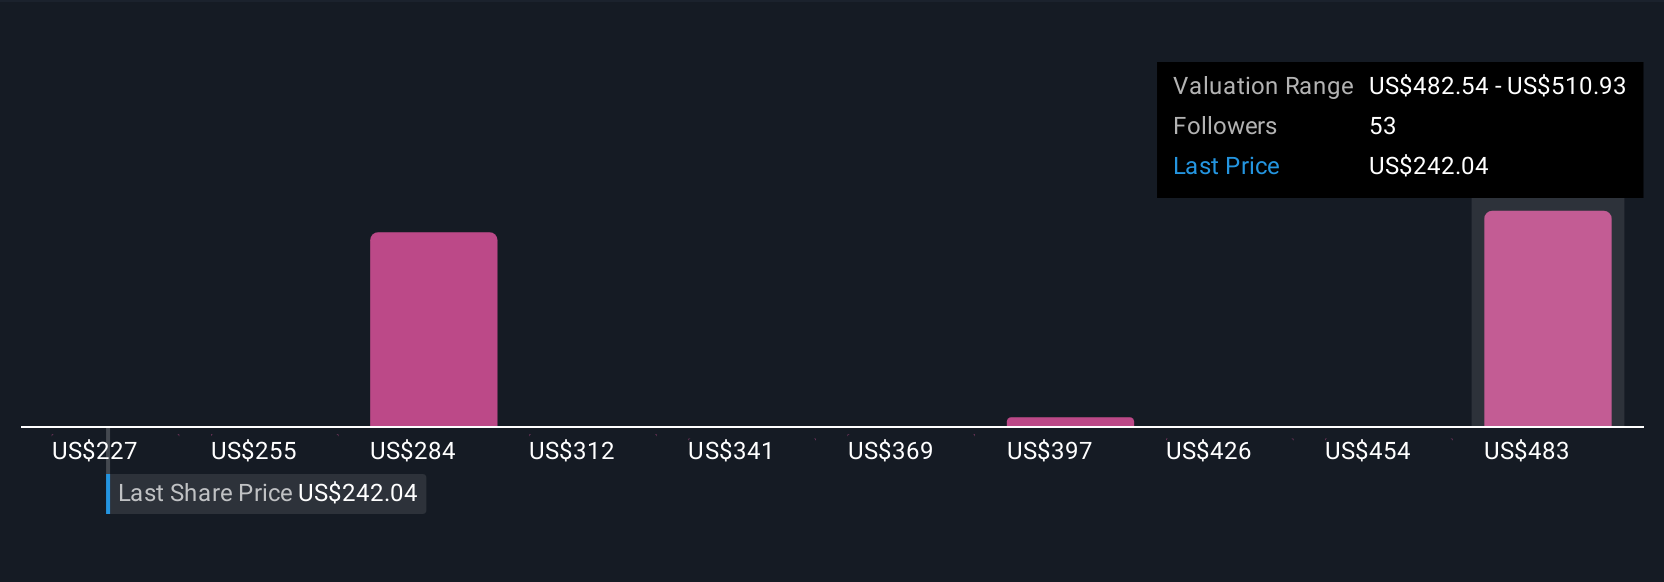
Earlier we mentioned that there is an even better way to understand valuation, so let us introduce you to Narratives, a simple way to attach a clear story, your assumptions for future revenue, earnings and margins, and a resulting fair value to a company, then track how that story holds up over time. On Simply Wall St’s Community page, used by millions of investors, a Narrative links your view of Progressive’s competitive strengths, risks and industry backdrop to a structured financial forecast and, ultimately, to a fair value you can compare with the current share price to inform your own decision. Because Narratives are dynamic, they automatically update when new data comes in, like earnings releases, news or revisions to analyst forecasts, so your thesis is always grounded in the latest information. For Progressive today, one investor might build a bullish Narrative that leans towards the higher fair value implied by optimistic targets around $344, while another could adopt a more cautious Narrative closer to the lower end near $189, and the platform makes these different perspectives easy to create, compare and refine.
Do you think there's more to the story for Progressive? Head over to our Community to see what others are saying!
This article by Simply Wall St is general in nature. We provide commentary based on historical data and analyst forecasts only using an unbiased methodology and our articles are not intended to be financial advice. It does not constitute a recommendation to buy or sell any stock, and does not take account of your objectives, or your financial situation. We aim to bring you long-term focused analysis driven by fundamental data. Note that our analysis may not factor in the latest price-sensitive company announcements or qualitative material. Simply Wall St has no position in any stocks mentioned.
Have feedback on this article? Concerned about the content? Get in touch with us directly. Alternatively, email editorial-team@simplywallst.com