
- PREMIUM
- LIVE QUOTES
- INSTITUTION
 Index Options
 State Street
 CME Group
 Nasdaq
 Cboe
Cboe TradingView
 Wall Street Journal
Is It Too Late to Consider CorMedix After Its Recent Share Price Rally?
- Wondering if CorMedix at around $10 a share is still a smart bet or if the easy money has already been made? This breakdown will help you figure out whether the current price lines up with the company’s true value.
- The stock is up 6.9% over the last week and 25.5% year to date, but that comes after a choppy 30 day patch where it slipped 10.6%, a pattern that often reflects shifting views on both its growth runway and risk profile.
- Recent headlines have focused on CorMedix’s progress in advancing its lead infection prevention therapy and securing broader market access. This has been a key driver of long term optimism. At the same time, ongoing regulatory and commercialization updates have kept volatility elevated, as investors reprice the odds of how quickly revenue can ramp.
- Despite that noise, CorMedix currently scores a solid 5/6 on our valuation checks, suggesting the market may not be fully crediting its fundamentals yet. Next, we will walk through the standard valuation methods before finishing with a more holistic way to think about what the stock is really worth.
Find out why CorMedix's 6.6% return over the last year is lagging behind its peers.
Approach 1: CorMedix Discounted Cash Flow (DCF) Analysis
A Discounted Cash Flow, or DCF, model estimates what a business is worth today by forecasting the cash it could generate in the future and discounting those cash flows back to the present.
For CorMedix, the latest twelve month free cash flow is about $73.9 Million. Analysts and internal projections see this rising materially over time, with free cash flow expected to reach roughly $238.9 Million by 2035. The early years of the forecast are based on analyst estimates, while the later years are extrapolated by Simply Wall St using a 2 Stage Free Cash Flow to Equity framework that tapers growth as the business matures.
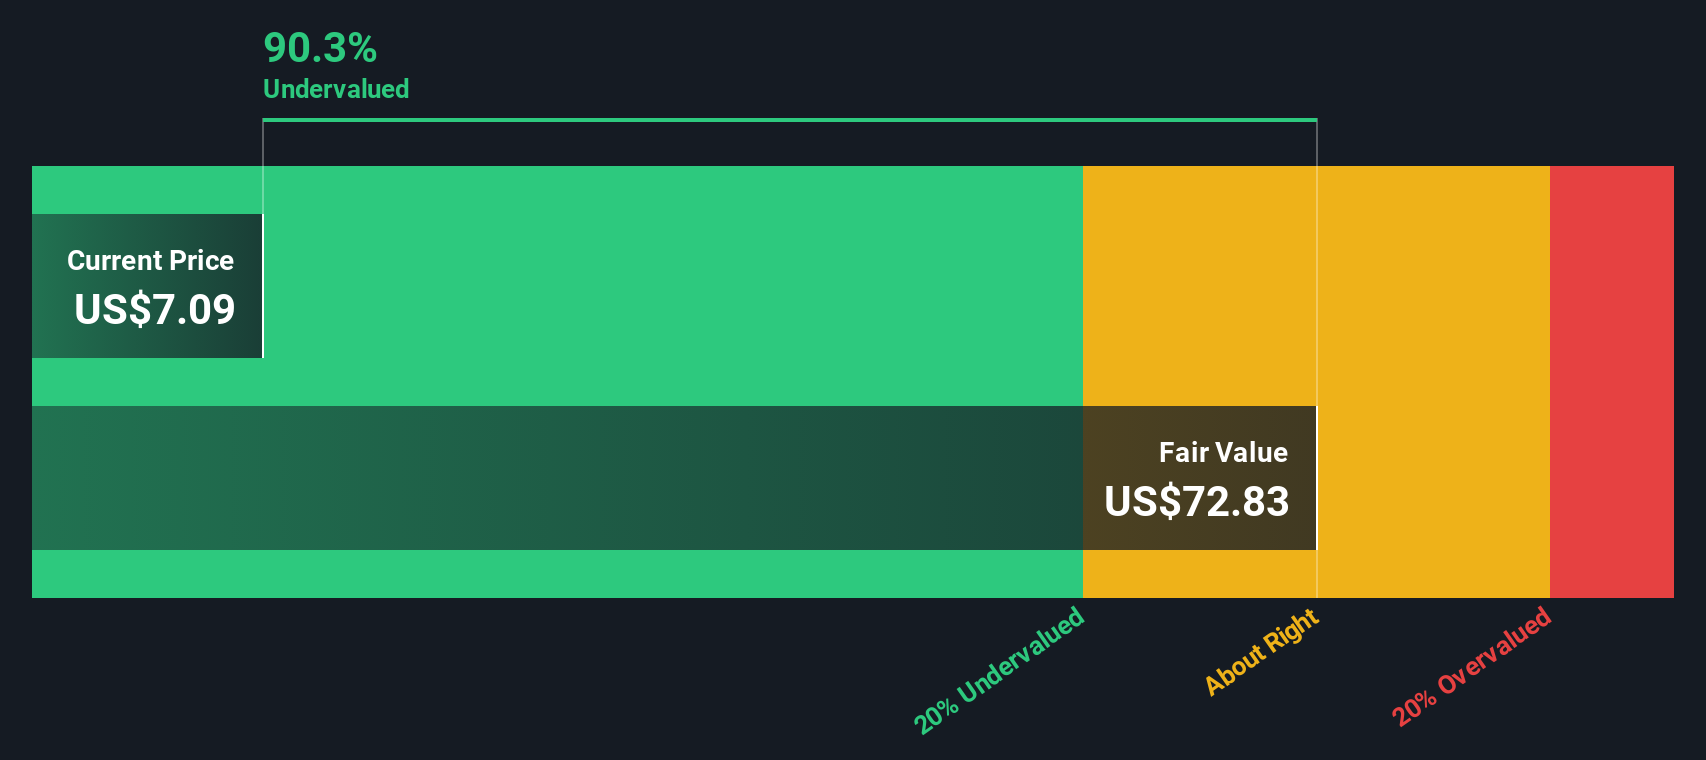
When all those future cash flows are discounted back, the model produces an estimated intrinsic value of about $63.07 per share. Compared with the current share price around $10, the DCF implies CorMedix is trading at an 83.6% discount to its calculated fair value, which indicates potential upside if the projected cash flow ramp occurs.
Result: UNDERVALUED
Our Discounted Cash Flow (DCF) analysis suggests CorMedix is undervalued by 83.6%. Track this in your watchlist or portfolio, or discover 917 more undervalued stocks based on cash flows.
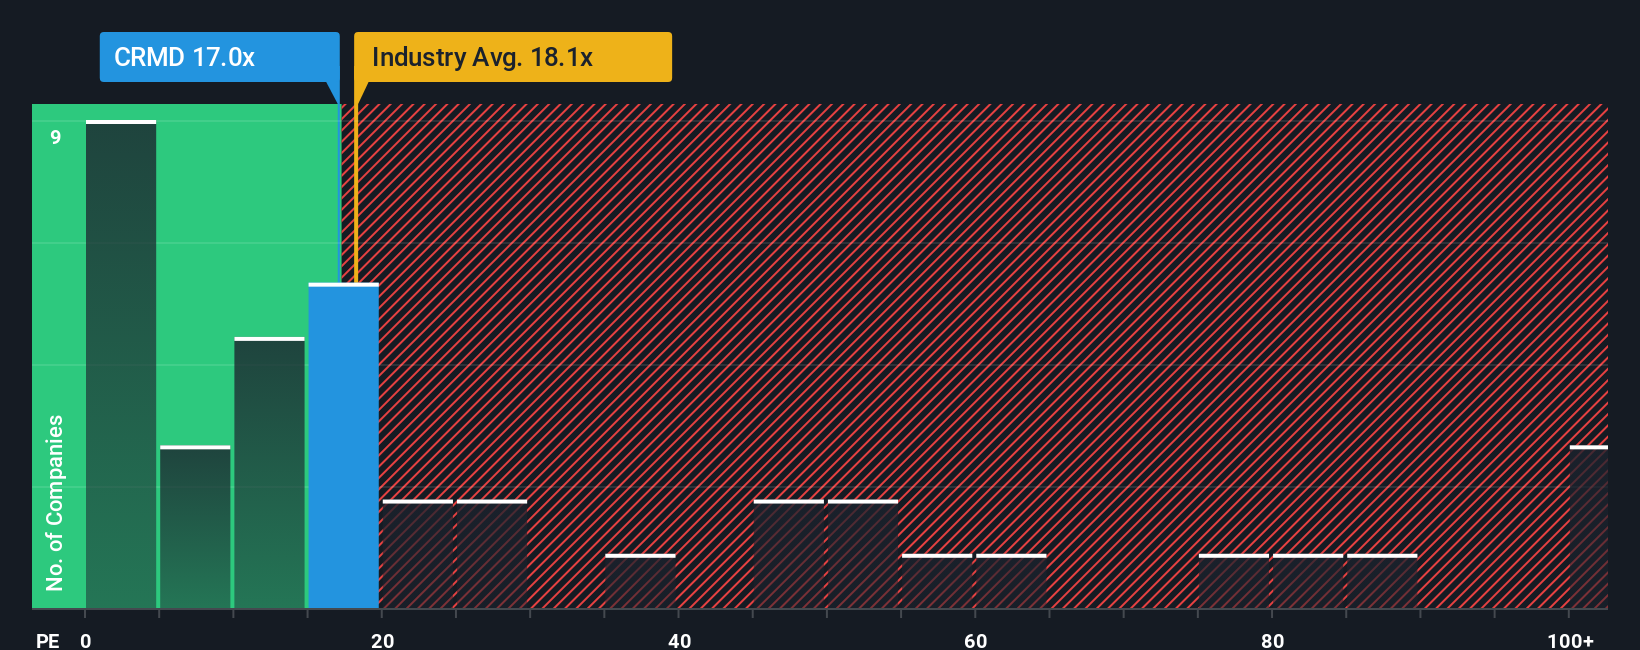
Approach 2: CorMedix Price vs Earnings
For profitable companies like CorMedix, the price to earnings, or PE, ratio is a straightforward way to gauge how much investors are willing to pay for each dollar of current earnings. A higher PE typically reflects stronger growth expectations and lower perceived risk, while a lower PE can signal either modest growth prospects or elevated uncertainty.
CorMedix currently trades at about 5.00x earnings, well below the Pharmaceuticals industry average of roughly 20.03x and also below the broader peer group average of about 23.15x. On the surface, that kind of discount suggests the market is cautious about the company’s outlook or risk profile.
Simply Wall St’s Fair Ratio framework refines this comparison by estimating what a “normal” PE should be for CorMedix, given its earnings growth, margins, industry, market cap, and risk factors. For CorMedix, that Fair Ratio comes out to around 17.25x, which is far more tailored than a simple industry or peer comparison. Because the current PE of 5.00x sits well below this Fair Ratio, this multiple-based view also points to the shares being materially undervalued at today’s price.
Result: UNDERVALUED
PE ratios tell one story, but what if the real opportunity lies elsewhere? Discover 1443 companies where insiders are betting big on explosive growth.
Upgrade Your Decision Making: Choose your CorMedix Narrative
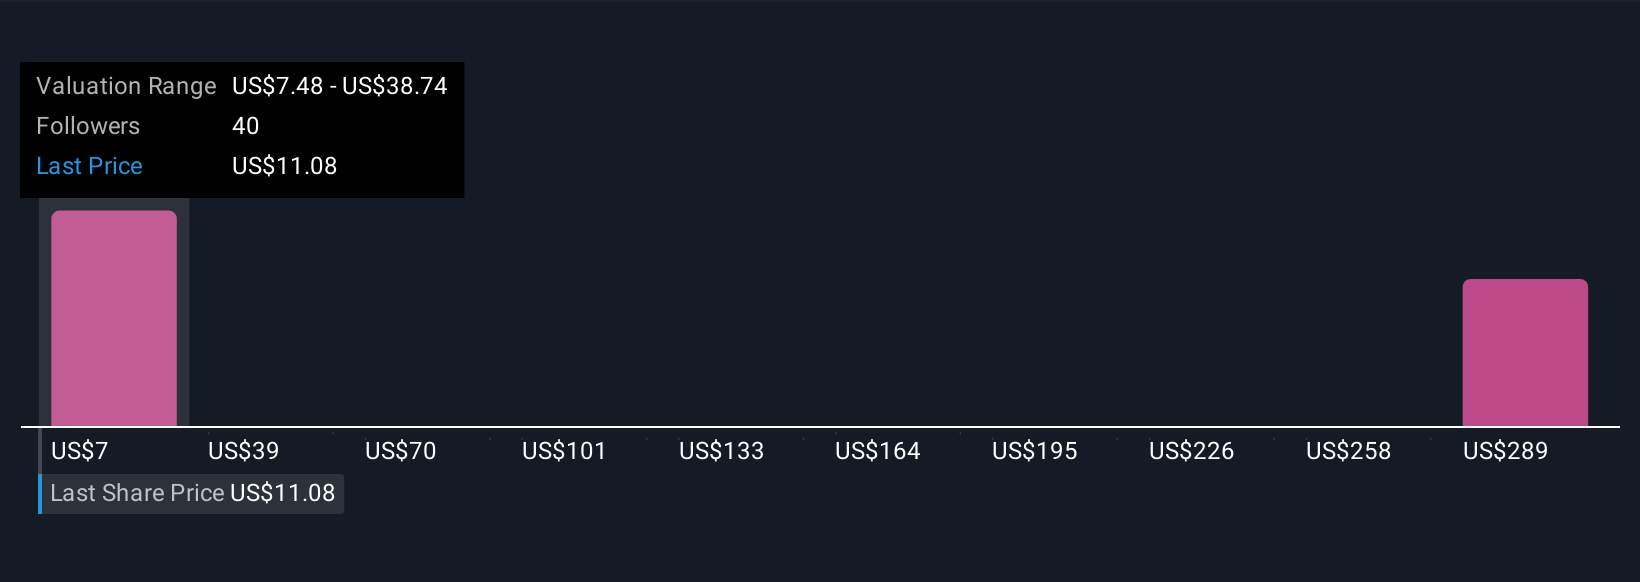
Earlier we mentioned that there is an even better way to understand valuation, so let us introduce you to Narratives, which are simply your story about CorMedix, where you spell out what you think will happen to its revenue, earnings, and margins, and then connect that story to a financial forecast and a fair value that you can compare with today’s share price. On Simply Wall St’s Community page, millions of investors use Narratives as an easy, visual tool to turn their view of a company into numbers, see whether it looks undervalued or overvalued, and decide if that means buy, hold, or sell. Because Narratives update dynamically when new information arrives, such as Q3 sales surprises, Phase III trial results, or changes to the $19 fair value estimate and related assumptions, your view of CorMedix can evolve in real time. For example, one investor might build a bullish CorMedix Narrative around faster revenue growth, stronger margins, and a higher future PE that justifies a fair value well above $23, while another might emphasize execution, integration, and debt risks and land closer to $17. Yet both can clearly see how their assumptions lead to a specific fair value and compare it to the current price.
Do you think there's more to the story for CorMedix? Head over to our Community to see what others are saying!
This article by Simply Wall St is general in nature. We provide commentary based on historical data and analyst forecasts only using an unbiased methodology and our articles are not intended to be financial advice. It does not constitute a recommendation to buy or sell any stock, and does not take account of your objectives, or your financial situation. We aim to bring you long-term focused analysis driven by fundamental data. Note that our analysis may not factor in the latest price-sensitive company announcements or qualitative material. Simply Wall St has no position in any stocks mentioned.
Have feedback on this article? Concerned about the content? Get in touch with us directly. Alternatively, email editorial-team@simplywallst.com