
- PREMIUM
- LIVE QUOTES
- INSTITUTION
 Index Options
 State Street
 CME Group
 Nasdaq
 Cboe
Cboe TradingView
 Wall Street Journal
Assessing PPL’s Valuation After Recent Pullback and Grid Modernization Headlines
- Wondering if PPL is quietly offering value while everyone else is chasing the latest high growth story? You are not alone, and this is exactly the kind of setup where careful valuation work can really pay off.
- Despite a recent pullback, with the stock down 5.2% over the last week and 4.4% over the last month, PPL is still up 8.2% year to date and 5.6% over the last year, building on solid 3 year and 5 year gains of 33.1% and 44.9% respectively.
- Recent headlines have focused on PPL's ongoing grid modernization plans and regulatory developments in its key service territories, which investors often watch closely for clues about future returns and capital spending. There has also been broader sector chatter about how regulated utilities like PPL fit into the energy transition narrative, adding context to the stock's recent moves.
- Right now, PPL only scores a 2/6 valuation check score, suggesting that on most of our standard measures it does not screen as obviously undervalued. However, the real question is whether those traditional tools, and an even more insightful framework we will get to at the end, are telling the full story.
PPL scores just 2/6 on our valuation checks. See what other red flags we found in the full valuation breakdown.
Approach 1: PPL Discounted Cash Flow (DCF) Analysis
A Discounted Cash Flow model takes the cash PPL is expected to generate in the future, then discounts those projections back into today’s dollars to estimate what the business is worth now.
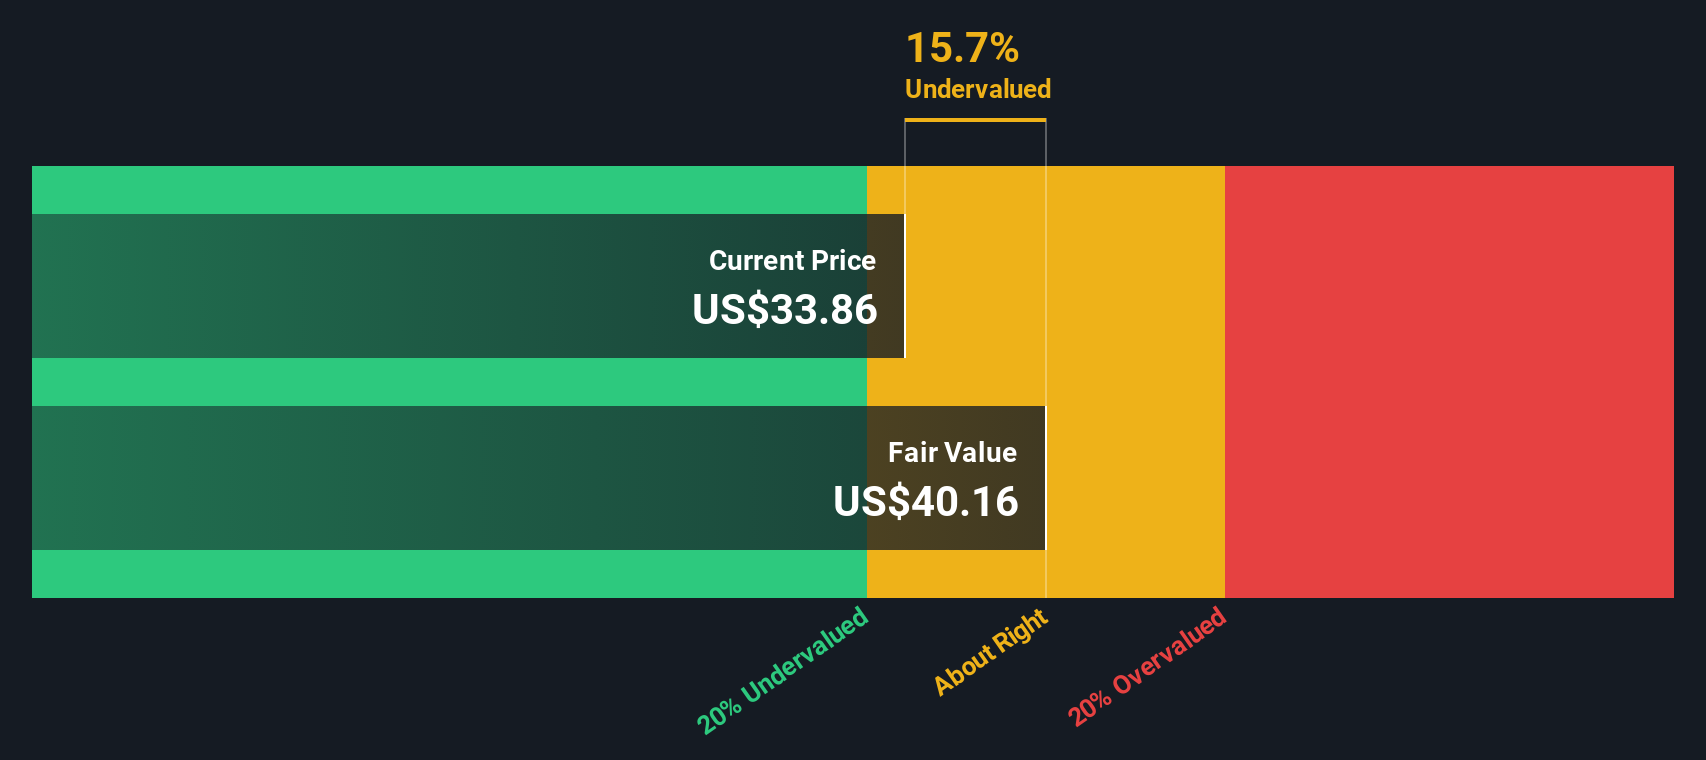
For PPL, the latest twelve month Free Cash Flow is slightly negative at about $0.43 billion, reflecting heavy investment and timing effects in the utility cycle. Analysts and extrapolated estimates, however, see this swinging firmly positive, with Free Cash Flow expected to reach around $1.31 billion by 2035 based on a 2 Stage Free Cash Flow to Equity model. These projections combine near term analyst forecasts with longer term trend based assumptions produced by Simply Wall St.
Using these cash flows, the model arrives at an intrinsic value of roughly $40.55 per share, in dollar terms. Compared with the current share price, this indicates that PPL is trading at a 14.1% discount, which may mean the market is underappreciating the value of its future cash generation.
Result: UNDERVALUED
Our Discounted Cash Flow (DCF) analysis suggests PPL is undervalued by 14.1%. Track this in your watchlist or portfolio, or discover 918 more undervalued stocks based on cash flows.
Approach 2: PPL Price vs Earnings
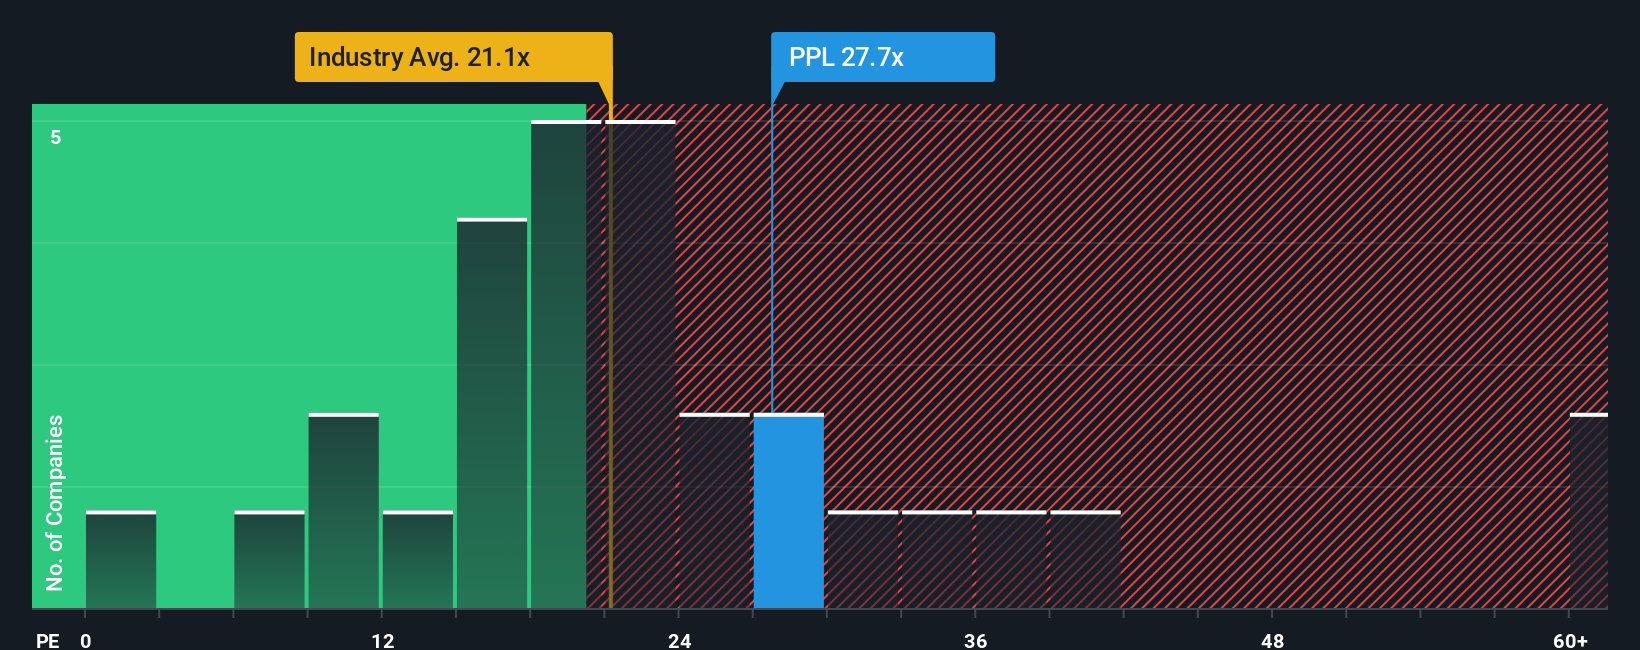
For a steady, profitable utility like PPL, the Price to Earnings, or PE, ratio is a natural way to gauge valuation, because it links what investors are paying directly to the company’s underlying earnings power. In general, faster growth and lower perceived risk justify a higher PE, while slower growth or higher risk should translate into a lower, more cautious multiple.
PPL currently trades on a PE of about 23.62x, which is above both the Electric Utilities industry average of 20.13x and the broader peer group average of 14.61x. On the surface, that might suggest the stock is a little pricey. However, Simply Wall St’s proprietary Fair Ratio framework estimates that, given PPL’s earnings growth profile, margins, industry, market cap and risk factors, a PE of around 24.41x would be reasonable.
This Fair Ratio is more insightful than simple peer comparisons, because it tailors the expected multiple to PPL’s specific fundamentals rather than assuming it should look like an average utility. With the Fair Ratio of 24.41x sitting just above the current 23.62x, the stock appears modestly undervalued on this earnings based lens.
Result: UNDERVALUED
PE ratios tell one story, but what if the real opportunity lies elsewhere? Discover 1443 companies where insiders are betting big on explosive growth.
Upgrade Your Decision Making: Choose your PPL Narrative
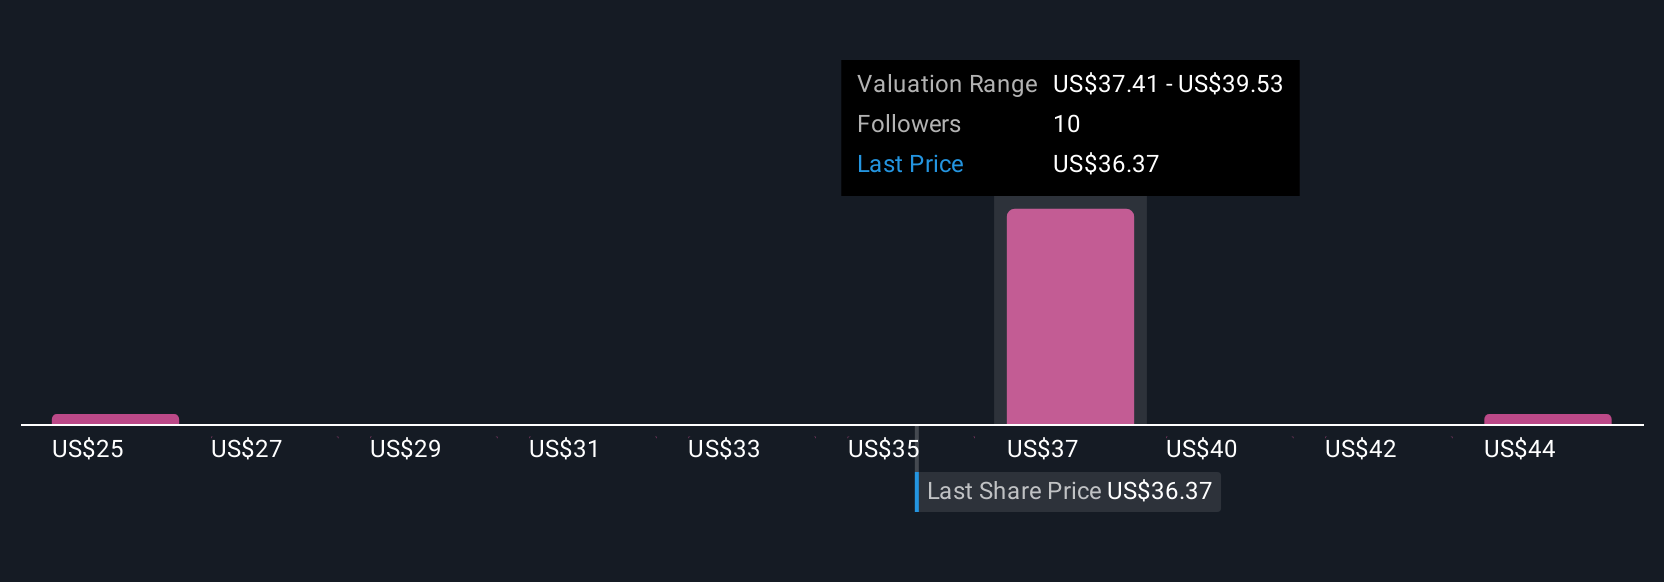
Earlier we mentioned that there is an even better way to understand valuation, so let us introduce you to Narratives, which are simply your story about a company linked directly to a set of financial forecasts and a fair value estimate. On Simply Wall St’s Community page, used by millions of investors, a Narrative lets you take your view of PPL’s future revenue growth, margins and earnings, turn that into a forecast, and then translate that into a Fair Value you can compare with today’s share price to help inform a decision to buy, hold or sell. Because Narratives update dynamically as new news, earnings or guidance arrives, your fair value view evolves with the facts instead of going stale. For example, one PPL Narrative might lean bullish, assuming data center driven demand and grid upgrades support a fair value closer to the current high analyst target of about $42. A more cautious Narrative might focus on regulatory and transition risks and land nearer the $34 low target. Seeing where your own assumptions sit between those bookends is where the real insight lies.
Do you think there's more to the story for PPL? Head over to our Community to see what others are saying!
This article by Simply Wall St is general in nature. We provide commentary based on historical data and analyst forecasts only using an unbiased methodology and our articles are not intended to be financial advice. It does not constitute a recommendation to buy or sell any stock, and does not take account of your objectives, or your financial situation. We aim to bring you long-term focused analysis driven by fundamental data. Note that our analysis may not factor in the latest price-sensitive company announcements or qualitative material. Simply Wall St has no position in any stocks mentioned.
Have feedback on this article? Concerned about the content? Get in touch with us directly. Alternatively, email editorial-team@simplywallst.com