
- PREMIUM
- LIVE QUOTES
 Index Options
 State Street
 CME Group
 Nasdaq
 Cboe
Cboe TradingView
 Wall Street Journal
M.Yochananof and Sons (1988) (TASE:YHNF): Assessing Valuation After Mixed Q3 and Nine-Month Earnings
M.Yochananof and Sons (1988) (TASE:YHNF) just posted mixed third quarter and nine month earnings, with higher sales but weaker profit metrics, a combination that naturally puts margins and future growth under the microscope.
See our latest analysis for M.Yochananof and Sons (1988).
Despite the squeeze on margins, the stock has enjoyed strong momentum, with a 13.5% 3 month share price return and a 45.78% 1 year total shareholder return, suggesting investors still see upside.
If this earnings update has you reassessing your watchlist, it could be a good moment to explore fast growing stocks with high insider ownership for other potential growth stories with significant insider ownership.
With revenues still climbing but earnings under pressure and the share price already up strongly, is M.Yochananof and Sons quietly trading below its true worth, or is the market already pricing in the next leg of growth?
Price-to-Earnings of 24.5x: Is it justified?
M.Yochananof and Sons (1988) is trading at ₪317.8 per share, and its 24.5x price-to-earnings multiple points to a richly valued stock versus peers.
The price-to-earnings ratio compares the current share price with the company’s earnings per share. It is a straightforward gauge of how much investors are paying for today’s profits. For a mature food retail business, this multiple often reflects expectations for steady cash generation and defensible margins rather than explosive growth.
With YHNF’s earnings actually declining over the past year and return on equity of 12.4% described as low, the market appears to be paying a premium for a business whose near term profit profile is under pressure. That suggests investors are either looking through the current margin compression or are willing to pay up for the company’s perceived quality of earnings and brand strength.
Compared to the broader Asian Consumer Retailing industry average price-to-earnings ratio of 16.7x, and an even lower peer average of 19.1x, YHNF’s 24.5x multiple stands out as meaningfully higher. This gap implies the market is assigning a substantial quality or growth premium relative to sector norms, even though recent earnings trends and margins do not obviously support such a high mark relative to comparable retailers.
See what the numbers say about this price — find out in our valuation breakdown.
Result: Price-to-Earnings of 24.5x (OVERVALUED)
However, if margin compression persists or there is a meaningful slowdown in consumer demand, the market’s optimism could be quickly challenged and YHNF’s elevated valuation could come under pressure.
Find out about the key risks to this M.Yochananof and Sons (1988) narrative.
Another View, SWS DCF Points to a Very Different Story
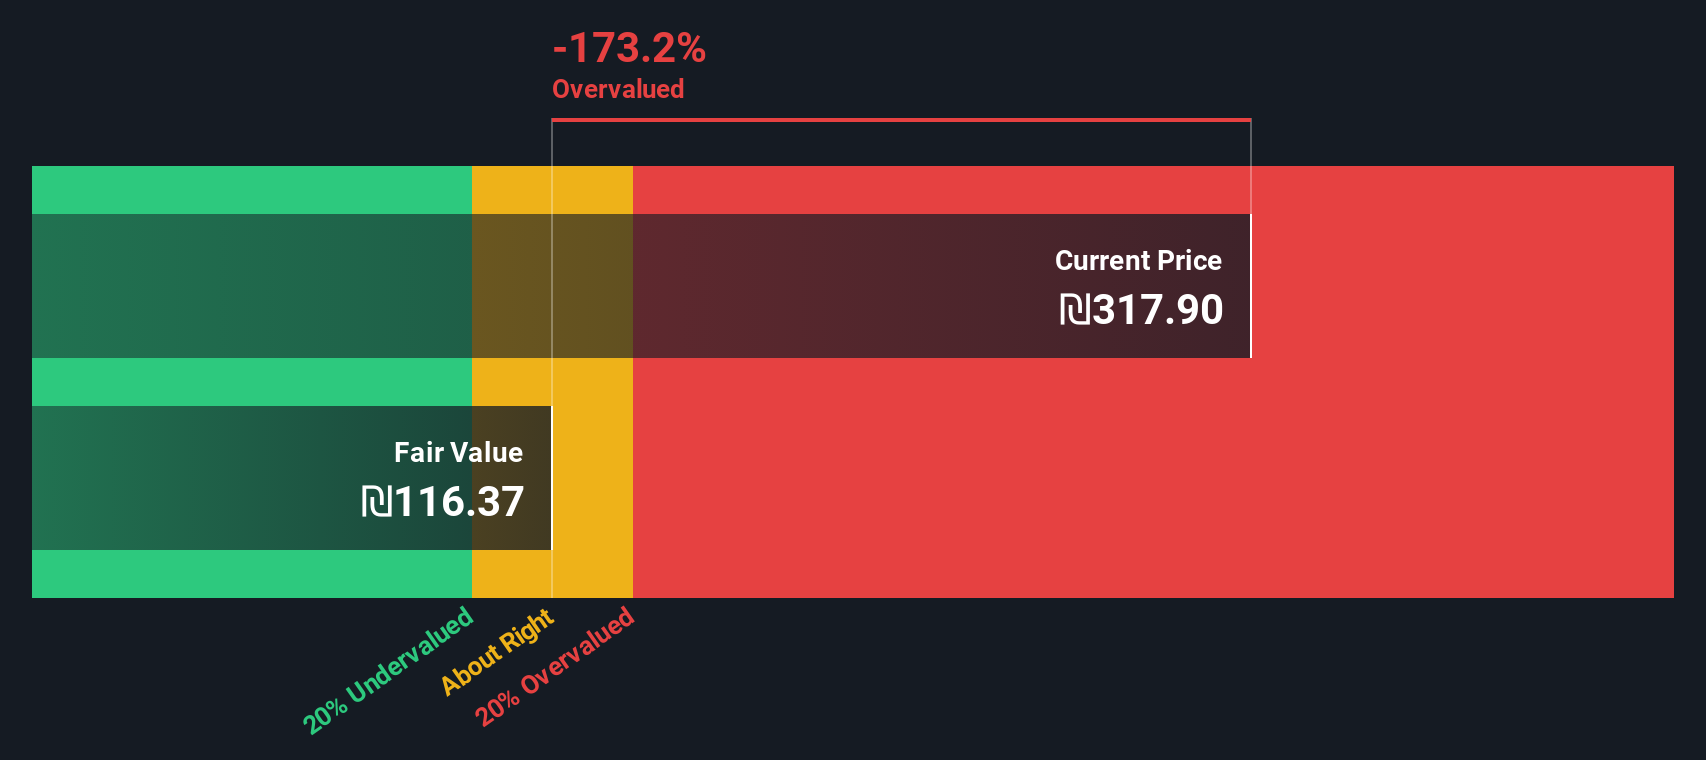
While the 24.5x earnings multiple suggests YHNF is expensive versus peers, our DCF model is even more cautious, implying fair value around ₪116.39, well below the ₪317.8 share price. That gap frames today’s rally as potential downside risk rather than opportunity, at least on this measure.
Look into how the SWS DCF model arrives at its fair value.
Simply Wall St performs a discounted cash flow (DCF) on every stock in the world every day (check out M.Yochananof and Sons (1988) for example). We show the entire calculation in full. You can track the result in your watchlist or portfolio and be alerted when this changes, or use our stock screener to discover 916 undervalued stocks based on their cash flows. If you save a screener we even alert you when new companies match - so you never miss a potential opportunity.
Build Your Own M.Yochananof and Sons (1988) Narrative
If you see the numbers differently or prefer to dig into the data yourself, you can build a custom view in just minutes: Do it your way.
Prefer to form your own view? Our platform makes it easy to explore a stock's fundamentals and create your own narrative in minutes.
Ready for your next move?
Do not stop at one stock when the market is full of potential, load up Simply Wall Street’s screener and secure your next smart opportunity today.
- Capture mispriced opportunities early by targeting these 916 undervalued stocks based on cash flows that the broader market has not fully appreciated yet.
- Tap into the surge of innovation by focusing on these 25 AI penny stocks positioned at the forefront of machine learning and automation.
- Lock in dependable cash flow potential through these 14 dividend stocks with yields > 3% that aim to reward shareholders year after year.
This article by Simply Wall St is general in nature. We provide commentary based on historical data and analyst forecasts only using an unbiased methodology and our articles are not intended to be financial advice. It does not constitute a recommendation to buy or sell any stock, and does not take account of your objectives, or your financial situation. We aim to bring you long-term focused analysis driven by fundamental data. Note that our analysis may not factor in the latest price-sensitive company announcements or qualitative material. Simply Wall St has no position in any stocks mentioned.
Have feedback on this article? Concerned about the content? Get in touch with us directly. Alternatively, email editorial-team@simplywallst.com