
- PREMIUM
- LIVE QUOTES
 Index Options
 State Street
 CME Group
 Nasdaq
 Cboe
Cboe TradingView
 Wall Street Journal
Asana (ASAN) Q3 2026: Wider Net Loss Challenges Gradual Path-to-Profitability Narrative
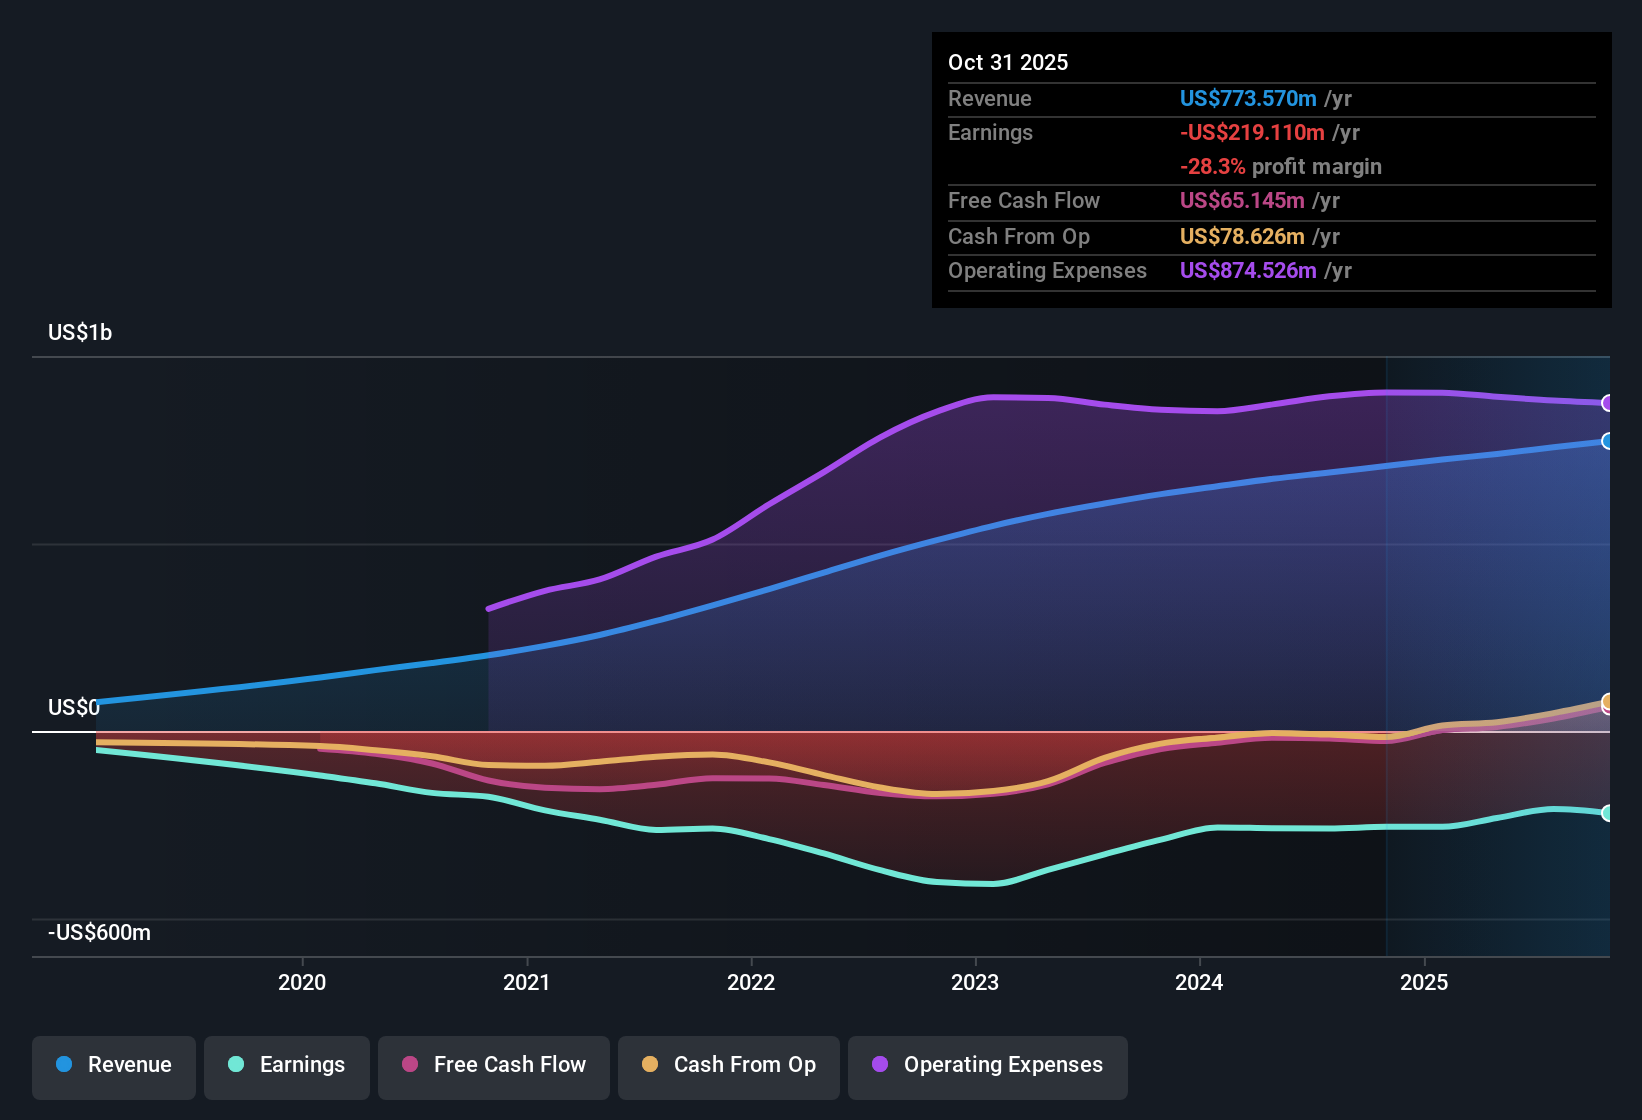
Asana (ASAN) just posted its Q3 2026 numbers, with revenue at about $201 million and basic EPS at roughly -$0.29. This keeps the focus firmly on how quickly the business can convert top line scale into a path toward profitability. The company has seen revenue move from around $179 million in Q2 2025 to roughly $201 million in Q3 2026, while basic EPS over that span has hovered between about -$0.31 and -$0.17. That sets up this quarter as another check in on whether margins are starting to turn the corner for long term holders.
See our full analysis for Asana.With the latest print on the table, the next step is to weigh these numbers against the dominant narratives around Asana, and to examine where the story of gradual improvement holds up and where the market’s assumptions might need updating.
See what the community is saying about Asana
Revenue Growth Slows Versus Market
- Over the last 12 months Asana generated about $773.6 million in revenue, growing roughly 8.9 percent per year, which is below the forecast 10.5 percent annual growth for the broader US market.
- Consensus narrative highlights AI driven workflow tools and international expansion as growth engines, yet
- The 8.9 percent revenue growth rate and ongoing trailing 12 month net loss of about $219.1 million show that scale is building more slowly than some bullish growth stories suggest.
- Forecasts that revenue will grow around 9.4 percent annually over the next three years align with this moderate pace rather than a rapid acceleration narrative.
Even with AI features and new enterprise use cases, investors need to decide if single digit revenue growth justifies a growth style valuation story. 🐂 Asana Bull Case
Losses Persist Despite TTM Improvement
- On a trailing 12 month basis, net loss is about $219.1 million with Basic EPS at roughly -$0.93, and management is not expected to reach profitability within the next three years.
- Bears focus on this extended loss profile and see risk that competitive pressures and compliance spending keep costs high, supported by
- A quarterly net loss that widened from about $40.0 million in Q1 2026 to roughly $68.4 million in Q3 2026 even as revenue rose from around $187.3 million to about $201.0 million.
- Ongoing forecasts that Asana will remain unprofitable for at least three years, which directly challenges any near term turnaround expectations.
Critics will likely point to the step up in quarterly losses as evidence that competitive and regulatory costs are still outweighing efficiency gains. 🐻 Asana Bear Case
Valuation Hints At Upside
- At a share price of about $14.43, Asana trades around 4.4 times sales, below the US software industry average of 4.8 times and peer average of 6.4 times, and roughly 16 percent under the DCF fair value of about $17.20.
- Supporters of the bullish narrative see this discount as an entry point, but
- The analyst price target of roughly $15.76 is only modestly above today’s price, suggesting expectations are not for a dramatic rerating based on current growth and loss trends.
- Ongoing unprofitability and recent insider selling over the past three months provide a counterweight to the apparent valuation gap versus DCF and peer multiples.
Next Steps
To see how these results tie into long-term growth, risks, and valuation, check out the full range of community narratives for Asana on Simply Wall St. Add the company to your watchlist or portfolio so you'll be alerted when the story evolves.
See the numbers differently? If your take diverges from the consensus, turn it into a clear, data backed story in minutes: Do it your way.
A great starting point for your Asana research is our analysis highlighting 3 key rewards and 2 important warning signs that could impact your investment decision.
See What Else Is Out There
Asana’s slowing revenue growth, persistent losses, and insider selling raise questions about whether its current risk profile justifies a growth style valuation.
If you want steadier prospects than this uneven growth and extended unprofitability, check out stable growth stocks screener (2071 results) to quickly focus on companies delivering consistent expansion and more predictable performance.
This article by Simply Wall St is general in nature. We provide commentary based on historical data and analyst forecasts only using an unbiased methodology and our articles are not intended to be financial advice. It does not constitute a recommendation to buy or sell any stock, and does not take account of your objectives, or your financial situation. We aim to bring you long-term focused analysis driven by fundamental data. Note that our analysis may not factor in the latest price-sensitive company announcements or qualitative material. Simply Wall St has no position in any stocks mentioned.
Have feedback on this article? Concerned about the content? Get in touch with us directly. Alternatively, email editorial-team@simplywallst.com