
- PREMIUM
- LIVE QUOTES
- INSTITUTION
 Index Options
 State Street
 CME Group
 Nasdaq
 Cboe
Cboe TradingView
 Wall Street Journal
Is Illinois Tool Works Offering Long Term Value After Recent Share Price Stagnation?
- If you have ever wondered whether Illinois Tool Works at around $250 a share is quietly turning into a value opportunity or just clinging to a premium price tag, you are exactly who this breakdown is for.
- The stock is roughly flat year to date, up 0.4% over the last week and 2.8% over the last month, but still down about 7.1% over the past year even after delivering a solid 21.8% gain over 3 years and 35.8% over 5 years.
- That mixed performance has come as investors weigh ITW's position as a diversified industrial with long term pricing power and exposure to cyclical end markets, alongside a broader rotation within the capital goods sector. Recent headlines have focused on its steady capital returns and disciplined portfolio strategy, which help explain why the market hesitates to mark it down too aggressively despite softer sentiment toward industrials.
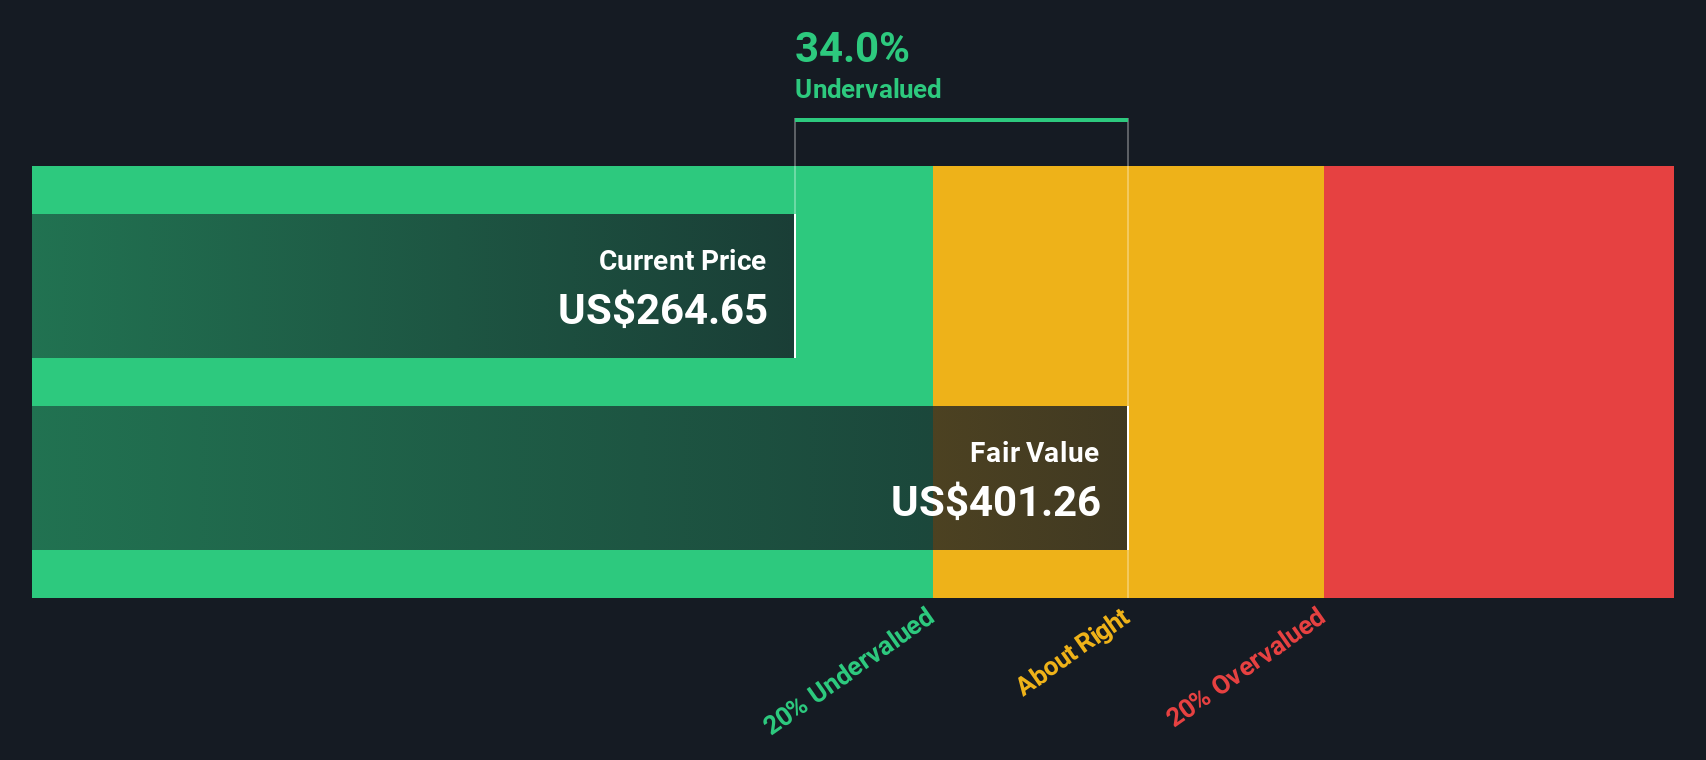
- On our framework, Illinois Tool Works currently scores a 5/6 valuation check, suggesting it looks undervalued on most, but not all, of our measures. In a moment we will walk through those methods, then finish with a more holistic way to think about what the stock is really worth.
Find out why Illinois Tool Works's -7.1% return over the last year is lagging behind its peers.
Approach 1: Illinois Tool Works Discounted Cash Flow (DCF) Analysis
A Discounted Cash Flow, or DCF, model estimates what a business is worth by projecting the cash it can generate in the future and then discounting those cash flows back to today in $ terms.
For Illinois Tool Works, the latest twelve month free cash flow is about $2.83 billion. Analysts provide detailed forecasts for the next few years, and those are then extended by Simply Wall St using a two stage Free Cash Flow to Equity model. In this model, projected free cash flow rises to roughly $13.67 billion in 2035. That path implies healthy growth from today’s levels as ITW continues to compound its cash generation.
When all those future cash flows are discounted back to the present, the model estimates an intrinsic value of about $571.39 per share. With the stock trading around $250, the DCF implies the shares are about 56.2% below this estimate, which would indicate potential undervaluation relative to the model’s assumptions.
Result: UNDERVALUED (based on this DCF model)
Our Discounted Cash Flow (DCF) analysis suggests Illinois Tool Works is undervalued by 56.2%. Track this in your watchlist or portfolio, or discover 921 more undervalued stocks based on cash flows.
Approach 2: Illinois Tool Works Price vs Earnings
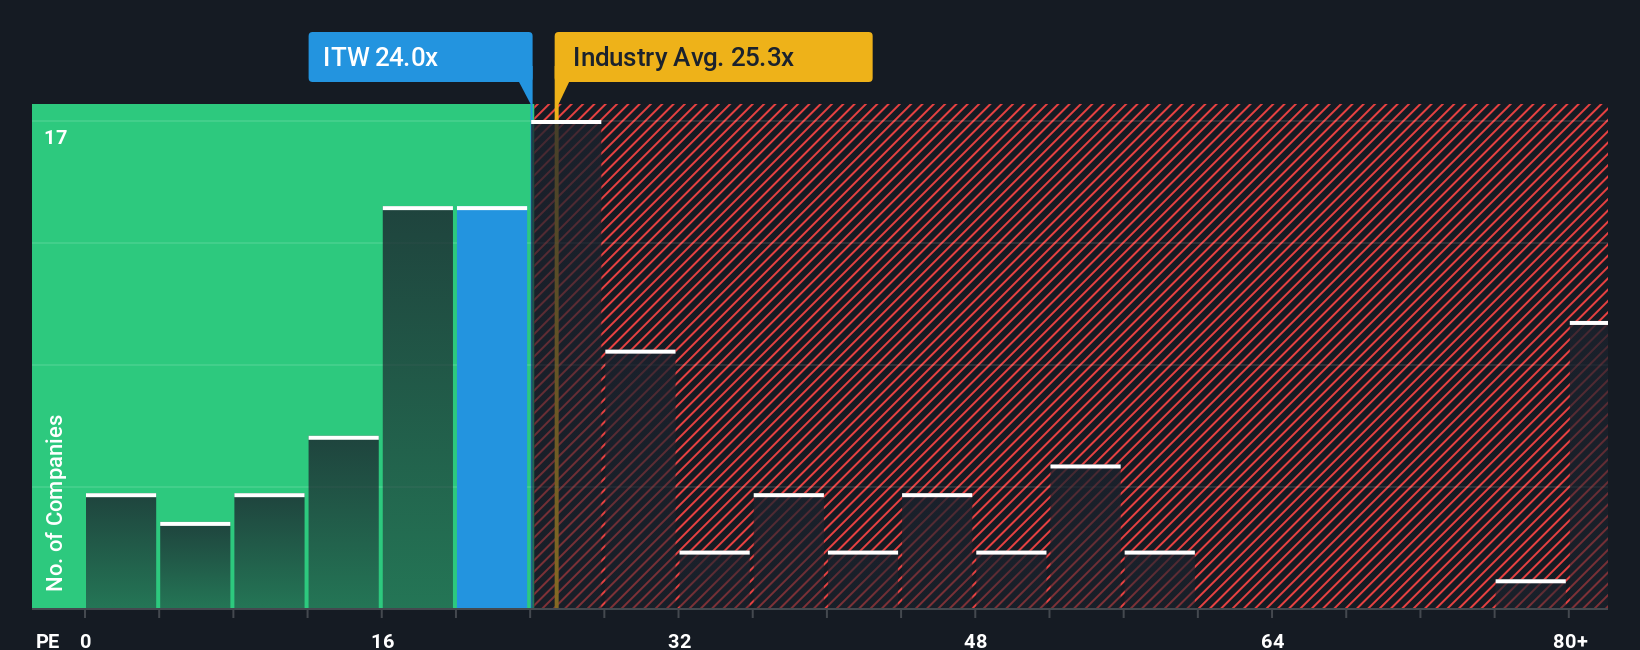
For a mature, consistently profitable business like Illinois Tool Works, the Price to Earnings, or PE, ratio is a useful way to gauge what investors are willing to pay for each dollar of current earnings. In general, companies with stronger growth prospects and lower risk can justify a higher PE, while slower growth or higher uncertainty should pull that multiple down.
Illinois Tool Works currently trades on about 24x earnings, which is very close to the broader Machinery industry average of roughly 24.2x and below the peer group average of about 34.4x. Simply Wall St also calculates a proprietary Fair Ratio of 26.2x for ITW, which reflects its specific mix of earnings growth, profitability, industry, size and risk profile.
This Fair Ratio is more informative than a simple comparison with peers or the industry, because it adjusts for how different ITW is from those groups on fundamentals rather than assuming one size fits all. With the stock on 24x versus a Fair Ratio of 26.2x, ITW screens as modestly undervalued on this earnings based lens.
Result: UNDERVALUED
PE ratios tell one story, but what if the real opportunity lies elsewhere? Discover 1439 companies where insiders are betting big on explosive growth.
Upgrade Your Decision Making: Choose your Illinois Tool Works Narrative
Earlier we mentioned that there is an even better way to understand valuation, so let us introduce you to Narratives, a simple way to connect your view of Illinois Tool Works’ business to a concrete forecast and Fair Value estimate so you can consider whether today’s price makes sense for you.
A Narrative is your story behind the numbers, where you set out how you think revenue, earnings and margins will evolve, and the platform turns that into a forward looking financial model and Fair Value that you can compare directly with the current share price to inform your investment decisions.
On Simply Wall St’s Community page, millions of investors use Narratives as an easy, accessible tool. Because they are dynamically updated when new information such as earnings releases, guidance changes or major news is released, your Fair Value view stays current without you rebuilding a spreadsheet every time.
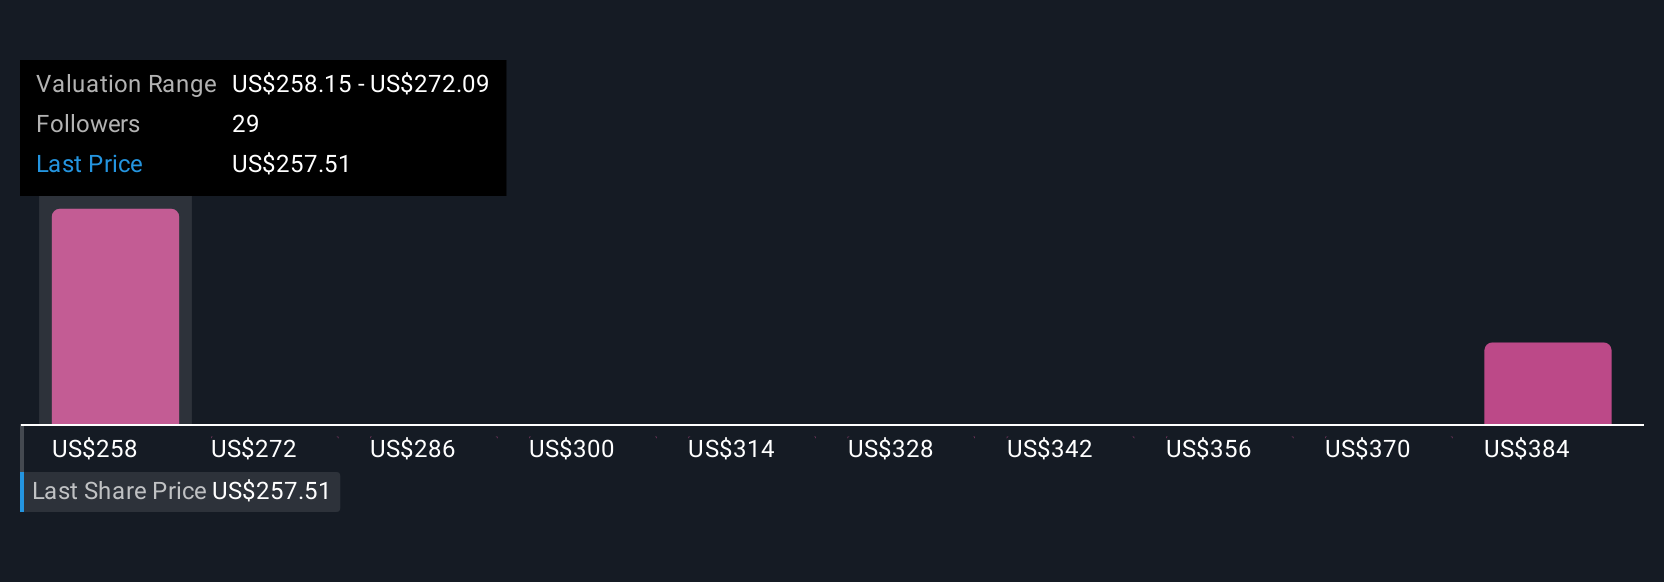
For Illinois Tool Works, one investor Narrative might lean toward the more optimistic analyst camp, with assumptions that lead to a Fair Value closer to $290 per share. A more cautious Narrative could emphasize cyclical risks and margin pressure, leading to a Fair Value nearer $215. This range highlights how different assumptions about the same company story can lead to very different but clearly quantified valuation views.
Do you think there's more to the story for Illinois Tool Works? Head over to our Community to see what others are saying!
This article by Simply Wall St is general in nature. We provide commentary based on historical data and analyst forecasts only using an unbiased methodology and our articles are not intended to be financial advice. It does not constitute a recommendation to buy or sell any stock, and does not take account of your objectives, or your financial situation. We aim to bring you long-term focused analysis driven by fundamental data. Note that our analysis may not factor in the latest price-sensitive company announcements or qualitative material. Simply Wall St has no position in any stocks mentioned.
Have feedback on this article? Concerned about the content? Get in touch with us directly. Alternatively, email editorial-team@simplywallst.com