
- PREMIUM
- LIVE QUOTES
- INSTITUTION
 Index Options
 State Street
 CME Group
 Nasdaq
 Cboe
Cboe TradingView
 Wall Street Journal
Is It Too Late To Consider Safran After Its Strong 2025 Share Price Rally?
- If you are wondering whether Safran’s strong share price run still leaves room for upside, or if you are late to the party, this article will walk through what the current valuation is really telling us.
- Over the last week the stock is up 2.6%, but that follows a 4.4% pullback over the past month, while longer term holders are still sitting on gains of 38.1% year to date and 31.3% over the last year.
- These moves are happening against a backdrop of robust aerospace demand and large backlogs at major customers such as Airbus and Boeing, as airlines continue to renew fleets with more fuel efficient aircraft. At the same time, ongoing geopolitical tensions and increased defense budgets have helped sustain interest in Safran’s military and security related businesses.
- Even with that momentum, Safran only scores 2/6 on our valuation checks. This suggests the market might already be pricing in a lot of good news, setting up an interesting discussion about whether traditional valuation methods capture the full picture or whether there is a better way to frame the stock’s current worth by the end of this article.
Safran scores just 2/6 on our valuation checks. See what other red flags we found in the full valuation breakdown.
Approach 1: Safran Discounted Cash Flow (DCF) Analysis
A Discounted Cash Flow model estimates what a business is worth today by projecting the cash it can generate in the future and discounting those cash flows back to the present. For Safran, the model used is a 2 Stage Free Cash Flow to Equity approach, based on cash flow projections rather than accounting profits.
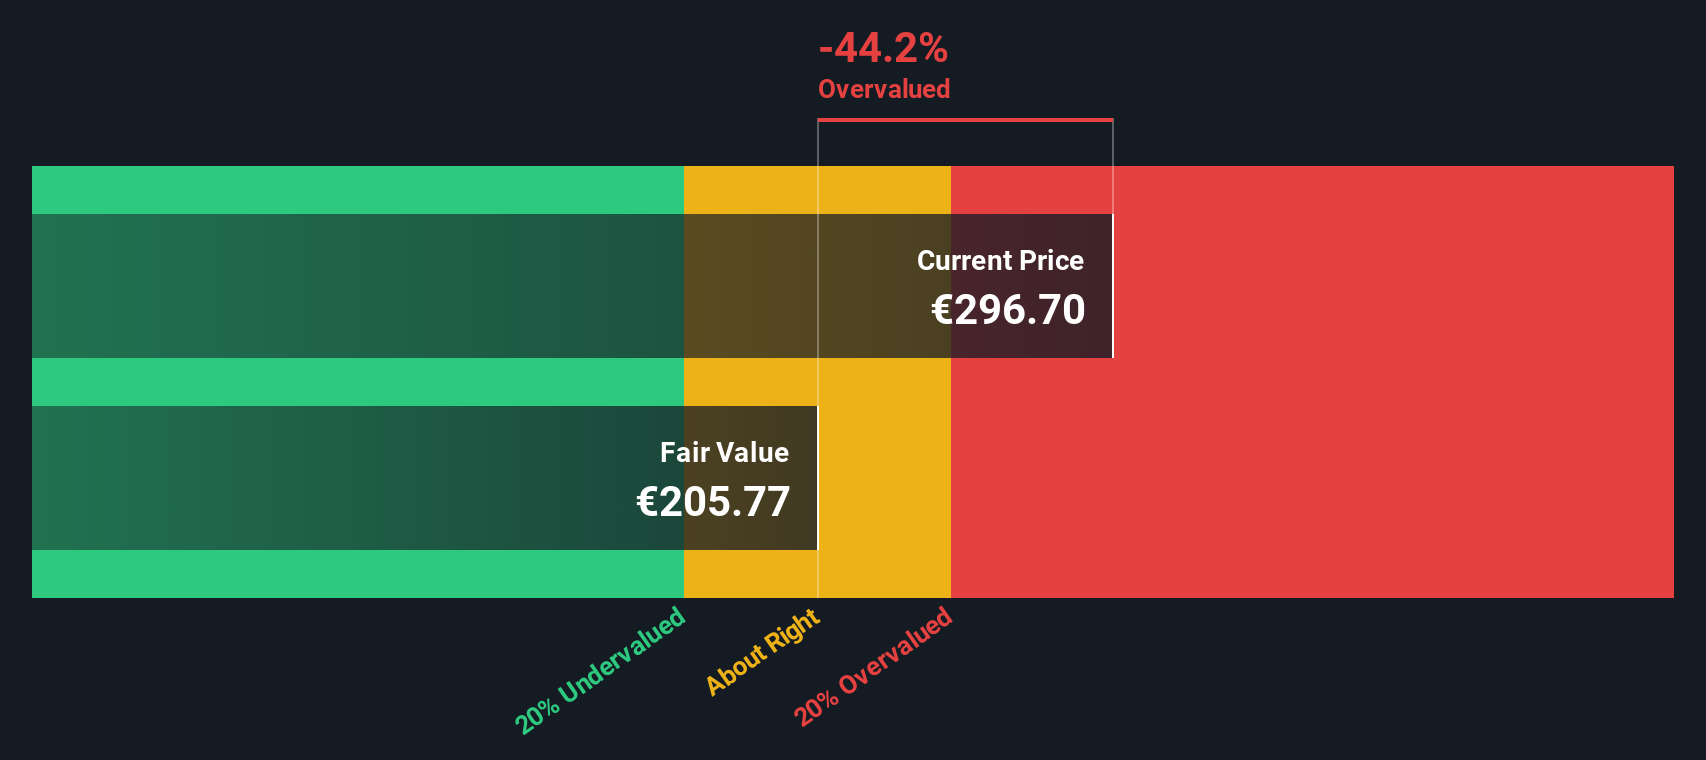
Safran currently generates about €3.56 billion in free cash flow, and analysts, plus Simply Wall St’s extrapolations, see this rising steadily over the coming decade. By 2029, projected free cash flow reaches roughly €5.86 billion, and by 2035 the extrapolated figure is about €7.65 billion, all in today’s money terms after discounting. These growing cash flows are then summed to arrive at an intrinsic value per share of around €289.94.
Compared with the current share price, the DCF output suggests Safran is about 2.3% overvalued, which is essentially within a reasonable margin of error for such models.
Result: ABOUT RIGHT
Safran is fairly valued according to our Discounted Cash Flow (DCF), but this can change at a moment's notice. Track the value in your watchlist or portfolio and be alerted on when to act.
Approach 2: Safran Price vs Earnings
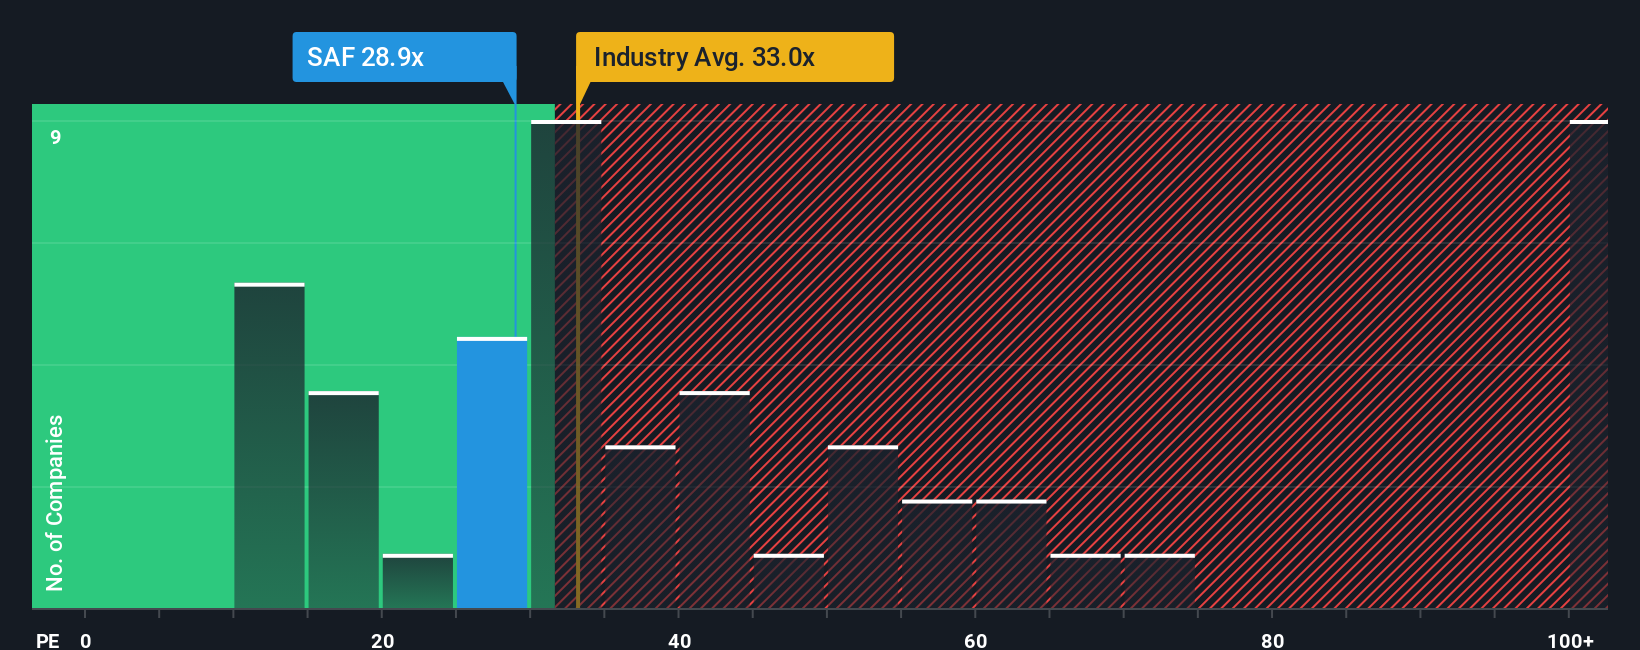
For profitable companies like Safran, the price to earnings, or PE, ratio is a straightforward way to check whether investors are paying a reasonable price for each euro of profit. A higher PE can be justified when a business has strong, reliable growth prospects and lower perceived risk. Slower or more uncertain growth usually deserves a lower, or “cheaper,” multiple.
Safran currently trades on about 28.7x earnings. That is below the broader Aerospace and Defense industry average of roughly 46.1x and also under the peer group average of around 34.5x, which might initially suggest the shares are not particularly expensive. However, Simply Wall St’s Fair Ratio model, which estimates what a stock’s PE should be after factoring in its growth outlook, profitability, size and risk profile, points to a fair PE of about 27.4x for Safran.
This Fair Ratio is more informative than a simple comparison with peers or the industry because it adjusts for Safran’s specific characteristics rather than assuming all aerospace names deserve the same multiple. With the current PE only modestly above the Fair Ratio, the shares appear slightly rich but broadly in line with their fundamentals.
Result: ABOUT RIGHT
PE ratios tell one story, but what if the real opportunity lies elsewhere? Discover 1439 companies where insiders are betting big on explosive growth.
Upgrade Your Decision Making: Choose your Safran Narrative
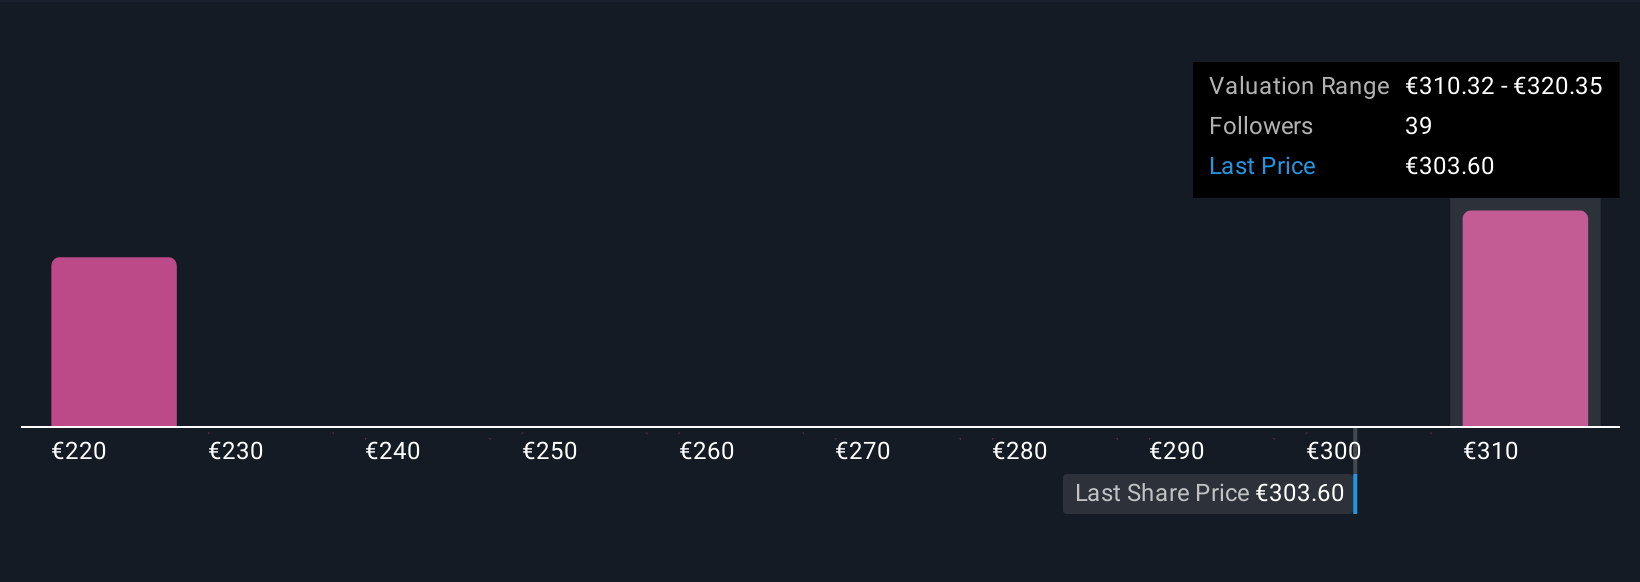
Earlier we mentioned that there is an even better way to understand valuation, so let us introduce you to Narratives, which are simply your own story about a company, backed by numbers like fair value, future revenue, earnings and margins, all tied together in one place. On Simply Wall St’s Community page, Narratives make this process easy and accessible by guiding you to link Safran’s business story, for example aftermarket strength, sustainable propulsion leadership, acquisitions and defense exposure, to a specific financial forecast and then to a fair value estimate. Once you have created or chosen a Narrative, you can quickly see how Safran compares to your own expectations by comparing that Narrative’s fair value range, say around €219 at the cautious end or €370 at the optimistic end, to today’s share price of about €281.6. Because these Narratives are updated dynamically whenever new information such as earnings, guidance changes or news arrives, they help you continuously refine your view and keep your decisions aligned with the latest facts rather than relying on static, one off valuation snapshots.
Do you think there's more to the story for Safran? Head over to our Community to see what others are saying!
This article by Simply Wall St is general in nature. We provide commentary based on historical data and analyst forecasts only using an unbiased methodology and our articles are not intended to be financial advice. It does not constitute a recommendation to buy or sell any stock, and does not take account of your objectives, or your financial situation. We aim to bring you long-term focused analysis driven by fundamental data. Note that our analysis may not factor in the latest price-sensitive company announcements or qualitative material. Simply Wall St has no position in any stocks mentioned.
Have feedback on this article? Concerned about the content? Get in touch with us directly. Alternatively, email editorial-team@simplywallst.com