
- PREMIUM
- LIVE QUOTES
 Index Options
 State Street
 CME Group
 Nasdaq
 Cboe
Cboe TradingView
 Wall Street Journal
Does Main Street Capital Still Offer Value After Its Strong Multi Year Share Price Run?
- If you are wondering whether Main Street Capital is still good value after its big run, or if the easy money has already been made, you are not alone.
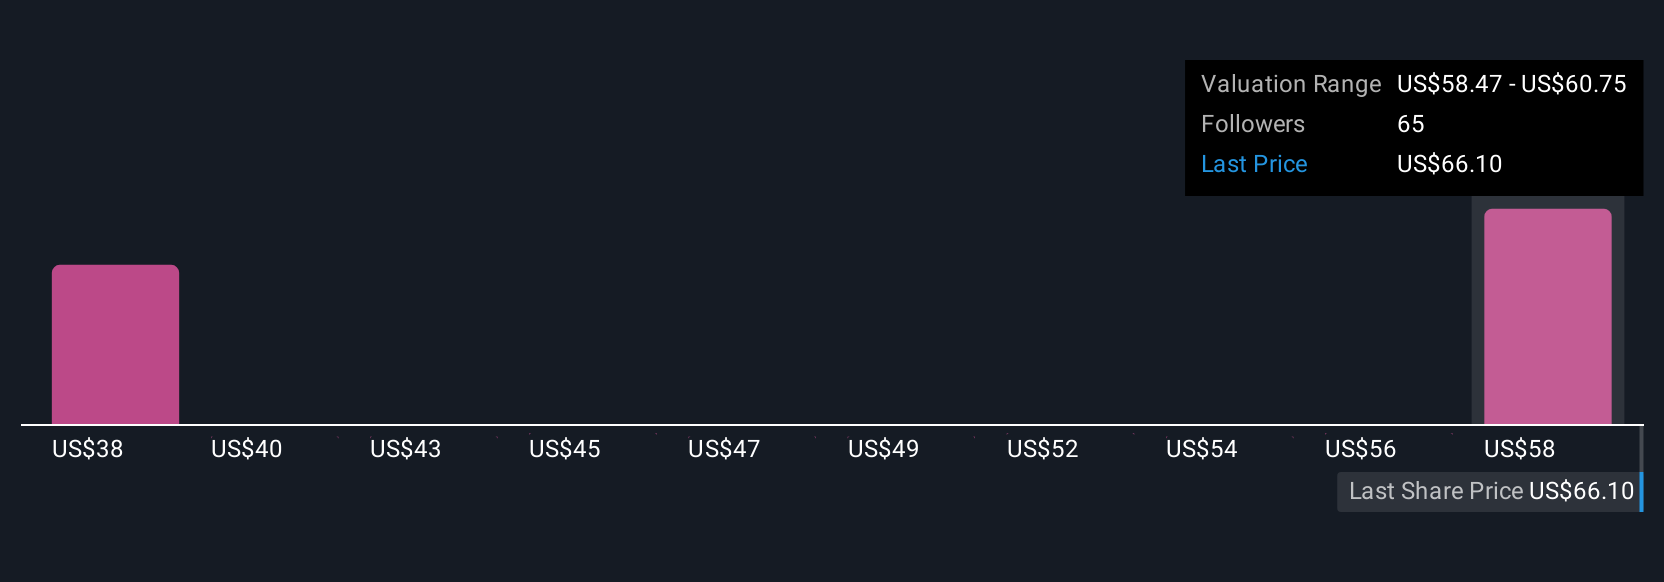
- The stock recently closed at $58.06. It is up 12.8% over the last year and 168.7% over five years. Short-term performance has been more muted, with gains of 0.6% over 7 days and 1.6% over 30 days, and the share price is down 2.0% year to date.
- Recent headlines have focused on Main Street Capital’s continued role as a key financier for lower middle market companies and its reputation for disciplined deal selection. Together, these factors help explain why investors have stuck with the name through cycles. Coverage has also highlighted its track record of dividend reliability and portfolio resilience, factors that can support the premium the market is willing to pay.
- On our framework, Main Street Capital scores a 2/6 valuation score, suggesting it screens as undervalued on only two of six checks. We will unpack what that means across different valuation approaches, and then finish by looking at a more complete way to think about value than just the usual multiples and models.
Main Street Capital scores just 2/6 on our valuation checks. See what other red flags we found in the full valuation breakdown.
Approach 1: Main Street Capital Excess Returns Analysis
The Excess Returns model looks at how much profit Main Street Capital can generate above the return that investors require on their equity, and then projects how long those value creating returns can be sustained.
For Main Street Capital, the model starts with a Book Value of $32.78 per share and a Stable EPS of $4.28 per share, based on weighted future Return on Equity estimates from 5 analysts. With an Average Return on Equity of 12.55% and a Stable Book Value of $34.06 per share, the business is expected to keep earning solid profits on its equity base over time.
Against a Cost of Equity of $3.12 per share, this implies an Excess Return of $1.16 per share, which is then capitalized to arrive at an intrinsic value estimate of about $53.70 per share. Compared with the recent share price around $58.06, the Excess Returns model suggests the stock is roughly 8.1% overvalued, so it screens as slightly expensive rather than a bargain.
Result: ABOUT RIGHT
Main Street Capital is fairly valued according to our Excess Returns, but this can change at a moment's notice. Track the value in your watchlist or portfolio and be alerted on when to act.

Approach 2: Main Street Capital Price vs Earnings
For profitable companies like Main Street Capital, the price to earnings (PE) ratio is a useful way to gauge how much investors are willing to pay for each dollar of current earnings. In broad terms, faster growth and lower perceived risk usually justify a higher, or more expensive, PE multiple, while slower growth or higher risk tend to pull that multiple down.
Main Street Capital currently trades on a PE of about 9.7x. That sits well below the broader Capital Markets industry average of roughly 23.8x and also below the peer group average of around 15.5x, suggesting the stock screens as cheaper than many competitors on earnings. However, simple comparisons like these do not fully capture differences in growth prospects, business quality or risk.
To address that, Simply Wall St uses a Fair Ratio, in this case 9.3x. This is the PE you would expect given Main Street Capital’s specific mix of earnings growth, margins, risk profile, industry and market cap. Because this approach is tailored to the company rather than broad groups, it tends to be more informative than raw peer or industry comparisons. With the current PE of 9.7x sitting close to the Fair Ratio of 9.3x, Main Street Capital looks roughly in line with its fundamentals on this metric.
Result: ABOUT RIGHT

PE ratios tell one story, but what if the real opportunity lies elsewhere? Discover 1441 companies where insiders are betting big on explosive growth.
Upgrade Your Decision Making: Choose your Main Street Capital Narrative
Earlier we mentioned that there is an even better way to understand valuation, so let us introduce you to Narratives, a simple way to turn your view of Main Street Capital into a story that connects your assumptions about future revenue, earnings and margins to a clear financial forecast and a fair value you can compare to today’s share price.
On Simply Wall St’s Community page, used by millions of investors, a Narrative is your personal storyline for a company, where you spell out what you think will drive the business, how that flows into the numbers, and what price those numbers justify, so you can see at a glance whether your fair value suggests buy, hold or sell at the current market price.
Because Narratives update dynamically as new news, earnings and analyst data flow in, your Main Street Capital story never goes stale, and you can easily see how different perspectives translate into different values. For example, one investor might build a cautious Narrative that supports a fair value closer to $45.0 while another, more optimistic Narrative could justify something closer to $52.0, helping both decide how to act as the price moves.
Do you think there's more to the story for Main Street Capital? Head over to our Community to see what others are saying!
This article by Simply Wall St is general in nature. We provide commentary based on historical data and analyst forecasts only using an unbiased methodology and our articles are not intended to be financial advice. It does not constitute a recommendation to buy or sell any stock, and does not take account of your objectives, or your financial situation. We aim to bring you long-term focused analysis driven by fundamental data. Note that our analysis may not factor in the latest price-sensitive company announcements or qualitative material. Simply Wall St has no position in any stocks mentioned.
Have feedback on this article? Concerned about the content? Get in touch with us directly. Alternatively, email editorial-team@simplywallst.com