
- PREMIUM
- LIVE QUOTES
 Index Options
 State Street
 CME Group
 Nasdaq
 Cboe
Cboe TradingView
 Wall Street Journal
Is It Too Late To Consider Dollar Tree After Its 42.5% Surge In 2025?
- If you are wondering whether Dollar Tree at around $109 is still attractively priced after its big run, or if you may be late to the party, this article will walk through what the current price implies about possible future returns.
- The stock is up 42.5% year to date and 47.6% over the last year, even after a recent 0.7% slip in the past week and an 8.1% jump over the last month. This indicates sentiment has shifted sharply despite a still negative 3 year and 5 year track record.
- That shift has come as investors refocus on the defensive appeal of discount retailers in a sticky inflation environment and the company advances its multi price strategy, expanding beyond the traditional $1 price point. At the same time, analysts have highlighted the potential for margin improvement from store optimization and merchandising changes. This helps explain why the market is now willing to pay more for each dollar of expected cash flow.
- Yet on our checks Dollar Tree only scores 1/6 on valuation, suggesting the market may already be pricing in much of that optimism. Next, we will break down what different valuation approaches indicate about the stock and then finish with a more holistic way to consider whether the current price makes sense.
Dollar Tree scores just 1/6 on our valuation checks. See what other red flags we found in the full valuation breakdown.
Approach 1: Dollar Tree Discounted Cash Flow (DCF) Analysis
The Discounted Cash Flow model estimates what a company is worth by projecting its future cash flows and discounting them back to today. For Dollar Tree, this 2 stage Free Cash Flow to Equity model starts with last twelve month free cash flow of about $1.89 billion and uses analyst forecasts for the next few years, then extrapolates further out.
Analysts currently see free cash flow moderating from recent levels, with projections stepping down toward an estimated $563.7 million by 2035 as growth slows. Simply Wall St converts these yearly forecasts into today’s dollars using a required rate of return, then adds a terminal value to capture cash flows beyond the explicit forecast period.
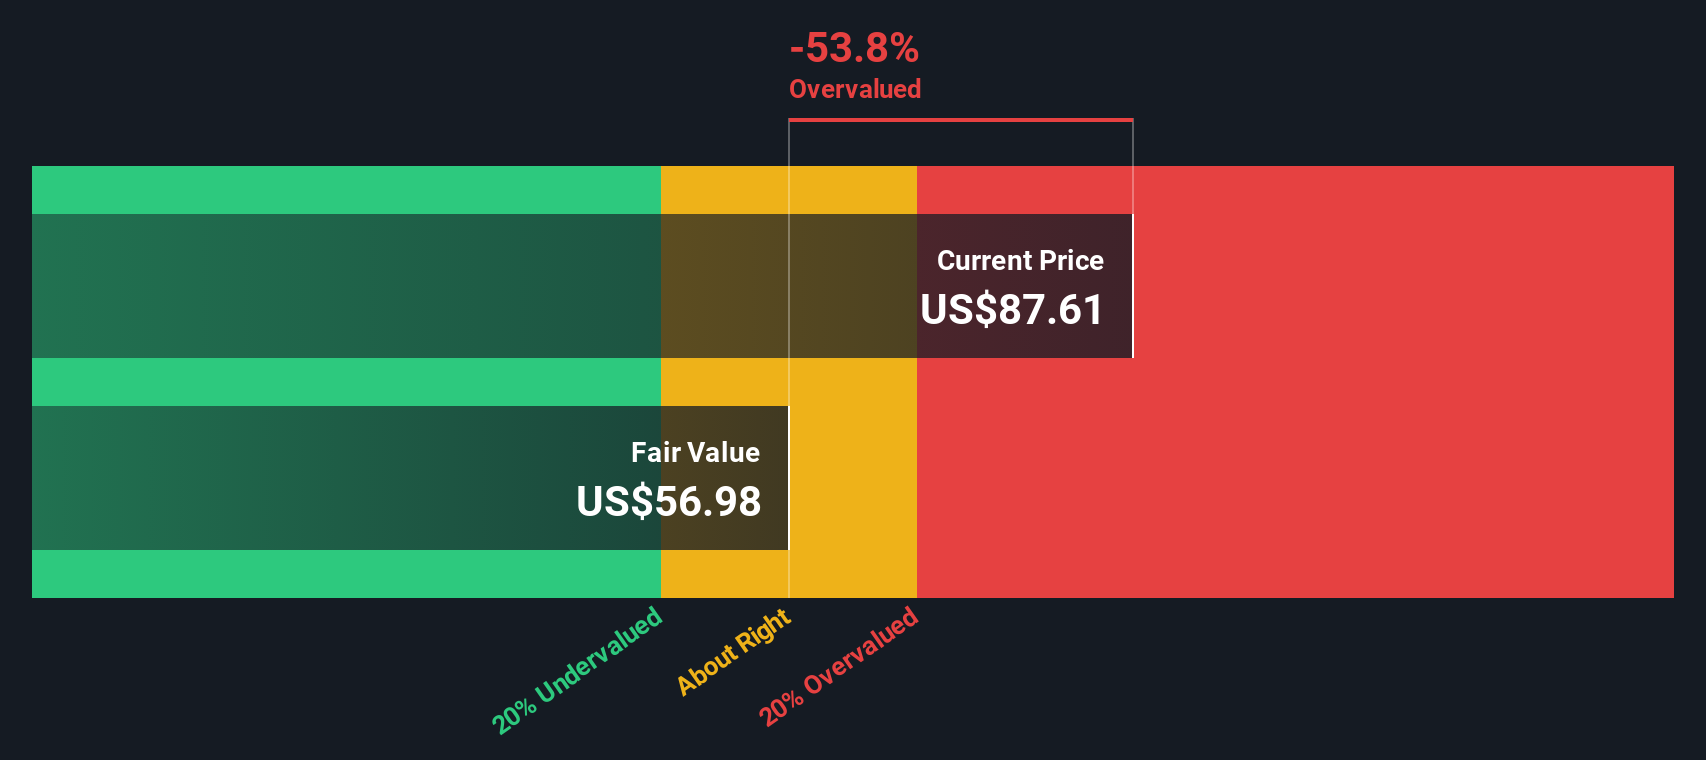
On this basis, the model arrives at an intrinsic value of roughly $58.40 per share. With the stock trading around $109, the DCF output implies Dollar Tree is about 86.6% overvalued. This indicates that the market may be assuming much stronger or more durable cash flows than this model uses.
Result: OVERVALUED
Our Discounted Cash Flow (DCF) analysis suggests Dollar Tree may be overvalued by 86.6%. Discover 926 undervalued stocks or create your own screener to find better value opportunities.
Approach 2: Dollar Tree Price vs Earnings
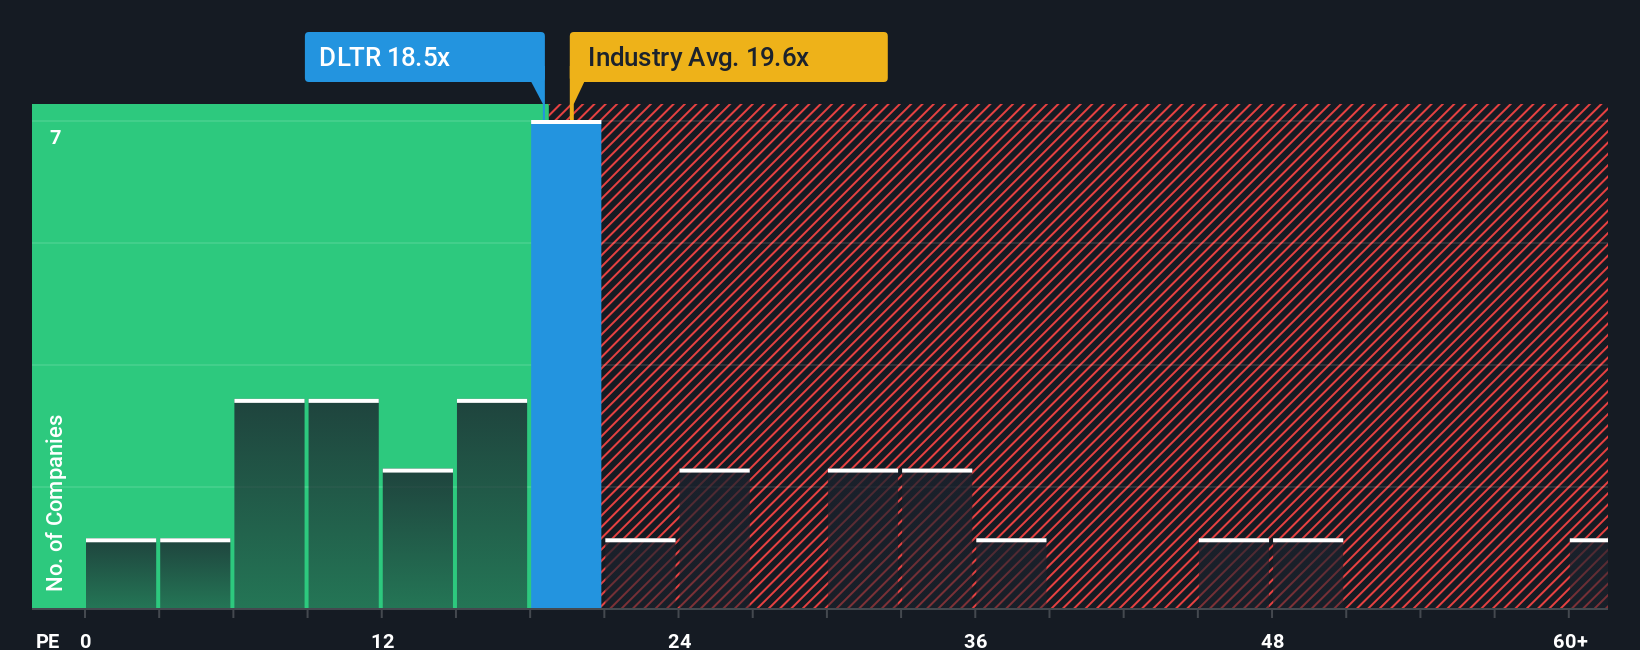
For a profitable retailer like Dollar Tree, the price to earnings ratio is a useful way to gauge whether investors are paying a reasonable price for each dollar of profit. In general, faster growing and lower risk companies can justify a higher PE multiple, while slower growth or greater uncertainty usually calls for a lower, more conservative PE.
Dollar Tree currently trades on a PE of about 20x, which is roughly in line with the Consumer Retailing industry average of around 20x and only slightly above the peer average of about 19.5x. At first glance, that suggests the market views Dollar Tree as a fairly typical stock within its space, neither a clear bargain nor an obvious outlier based just on simple comparisons.
Simply Wall St takes this a step further with its Fair Ratio, an estimate of what PE you would expect once you factor in Dollar Tree’s specific earnings growth outlook, margins, risk profile, industry and size. This makes it more tailored than broad peer or sector averages. For Dollar Tree, the Fair Ratio is 18.79x versus the current 20x, implying the shares are trading modestly above what those fundamentals might justify.
Result: OVERVALUED
PE ratios tell one story, but what if the real opportunity lies elsewhere? Discover 1441 companies where insiders are betting big on explosive growth.
Upgrade Your Decision Making: Choose your Dollar Tree Narrative
Earlier we mentioned that there is an even better way to understand valuation, so let us introduce you to Narratives, a simple way to connect your view of Dollar Tree’s story with a concrete forecast and Fair Value estimate. A Narrative is your own explanation for how you think the business will evolve, captured through your assumptions about future revenue, earnings and margins. The platform then turns these assumptions into a financial forecast and a Fair Value you can compare to today’s share price to help inform your decision to buy, hold or sell. On Simply Wall St’s Community page, millions of investors use Narratives as an accessible tool to quickly see how their story about Dollar Tree stacks up against others, with Fair Values that update dynamically as new earnings, news or guidance arrives. For example, one optimistic Narrative might lean toward something closer to the higher analyst target of about $140, assuming strong execution and sustained margin expansion. A more cautious Narrative might sit nearer $75, baking in consumer and cost pressures and implying very different buy or sell decisions at current prices.
Do you think there's more to the story for Dollar Tree? Head over to our Community to see what others are saying!
This article by Simply Wall St is general in nature. We provide commentary based on historical data and analyst forecasts only using an unbiased methodology and our articles are not intended to be financial advice. It does not constitute a recommendation to buy or sell any stock, and does not take account of your objectives, or your financial situation. We aim to bring you long-term focused analysis driven by fundamental data. Note that our analysis may not factor in the latest price-sensitive company announcements or qualitative material. Simply Wall St has no position in any stocks mentioned.
Have feedback on this article? Concerned about the content? Get in touch with us directly. Alternatively, email editorial-team@simplywallst.com