
- PREMIUM
- LIVE QUOTES
- INSTITUTION
 Index Options
 State Street
 CME Group
 Nasdaq
 Cboe
Cboe TradingView
 Wall Street Journal
Is Adecco Group Offering Value After 9.6% Share Price Drop This Week?
- Wondering if Adecco Group is quietly offering value while the market looks the other way? Let us unpack what the numbers are really saying about the stock.
- The share price has slipped about 9.6% over the last week and is roughly flat over 1 year, which hints that sentiment is cautious even though the long term decline of around 45.1% over 5 years may already have washed out some optimism.
- Recent headlines have focused on Adecco's strategic moves to streamline operations and sharpen its focus on higher margin HR solutions, alongside continued investment in digital staffing platforms and AI driven matching tools. These developments help explain why the market is reassessing both the growth potential and the risks baked into the current share price.
- Right now, Adecco scores a 5/6 valuation check rating, suggesting it screens as undervalued on most of the metrics we track. Next, we will break down those traditional valuation approaches and then finish with a more holistic way to judge whether the stock truly offers an edge.
Approach 1: Adecco Group Discounted Cash Flow (DCF) Analysis
A Discounted Cash Flow model estimates what a company is worth by projecting the cash it can generate in the future and discounting those streams back to today.
For Adecco Group, the model starts with last twelve month Free Cash Flow of about €463 Million, then uses analyst forecasts for the next few years before extrapolating trends further out. By 2029, Free Cash Flow is projected to be around €506 Million, with subsequent years gradually easing lower rather than assuming aggressive, uninterrupted growth. This two stage Free Cash Flow to Equity approach aims to balance near term expectations with a more conservative long term trajectory.
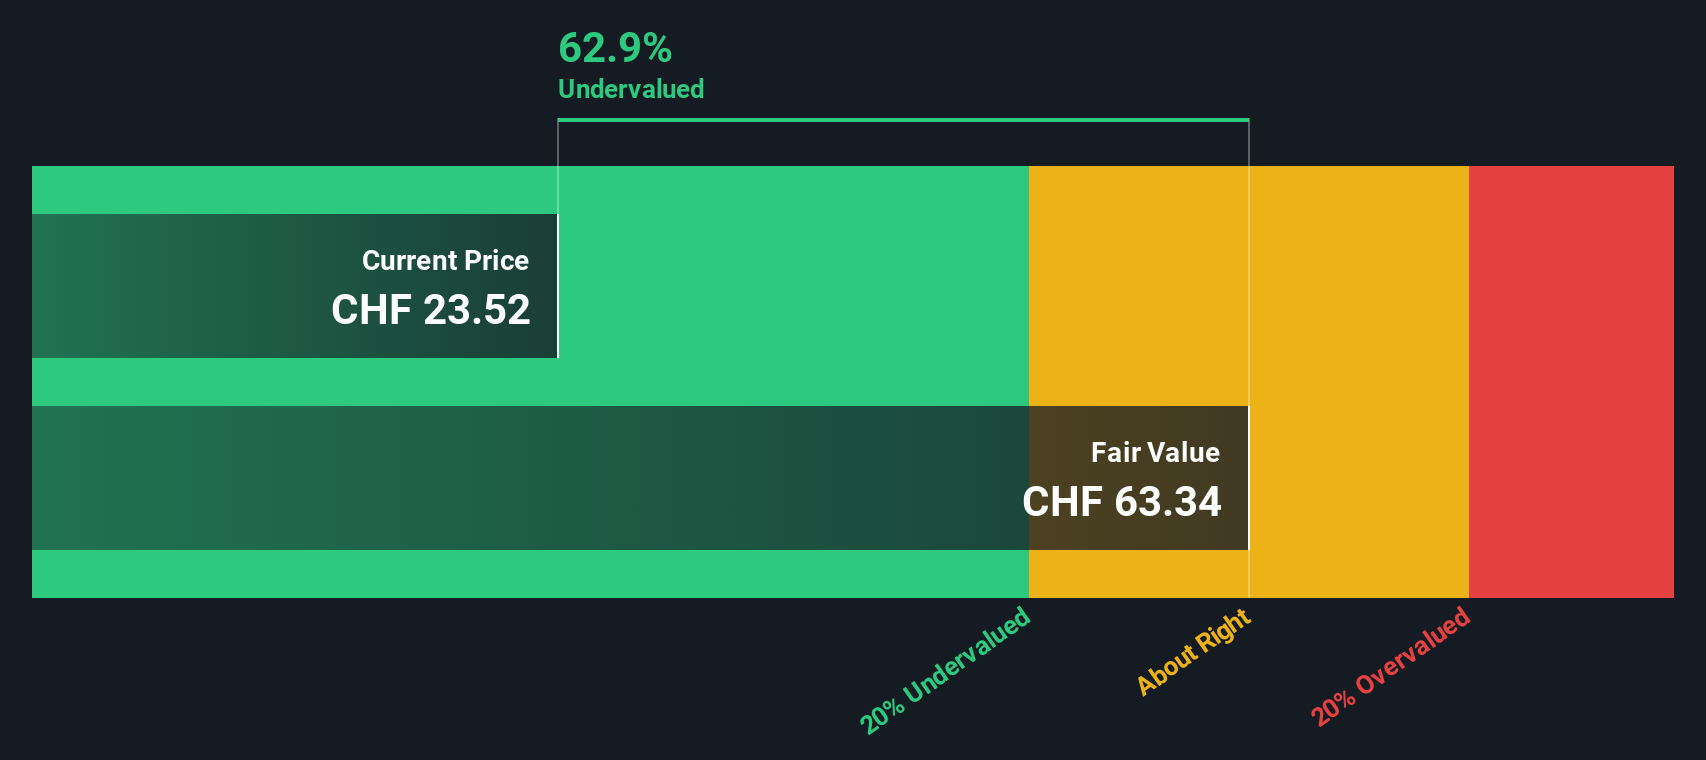
On this basis, the intrinsic value is estimated at CHF 47.85 per share, using the DCF fair value as the reference. Compared with the current market price, the model implies Adecco is trading at roughly a 53.3% discount. This points to potential undervaluation if these cash flow assumptions prove broadly accurate.
Result: UNDERVALUED
Our Discounted Cash Flow (DCF) analysis suggests Adecco Group is undervalued by 53.3%. Track this in your watchlist or portfolio, or discover 925 more undervalued stocks based on cash flows.
Approach 2: Adecco Group Price vs Earnings
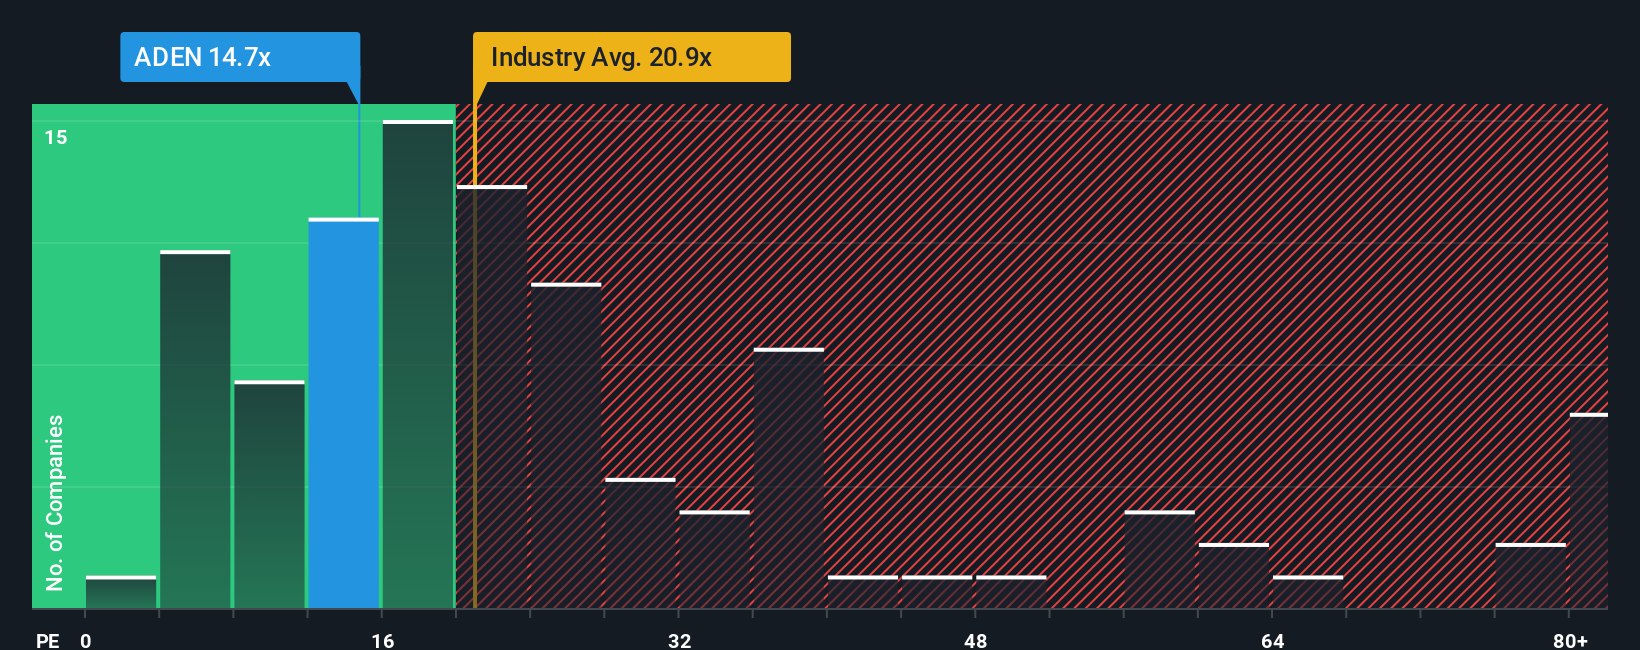
For profitable companies like Adecco Group, the Price to Earnings (PE) ratio is a practical way to gauge how much investors are willing to pay today for each unit of current earnings. A higher PE often reflects expectations of faster growth or lower perceived risk, while a lower PE can signal slower growth prospects, higher uncertainty, or simply a bargain if the market is too pessimistic.
Adecco currently trades on a PE of 14.31x, which sits below both the Professional Services industry average of about 17.63x and the broader peer group average of around 42.41x. To move beyond simple comparisons, Simply Wall St calculates a proprietary Fair Ratio, which for Adecco is 19.86x. This Fair Ratio represents the PE that might be expected given the company’s earnings growth profile, profit margins, risk factors, industry characteristics and market capitalization.
Because the Fair Ratio blends these fundamentals into a single yardstick, it offers a more tailored benchmark than raw industry or peer averages. With Adecco’s actual PE of 14.31x trading well below the Fair Ratio of 19.86x, the shares currently trade at a discount on an earnings multiple basis.
Result: UNDERVALUED
PE ratios tell one story, but what if the real opportunity lies elsewhere? Discover 1441 companies where insiders are betting big on explosive growth.
Upgrade Your Decision Making: Choose your Adecco Group Narrative
Earlier we mentioned that there is an even better way to understand valuation, so let us introduce you to Narratives, which are simply your own story about a company linked directly to the numbers you think are realistic for its future revenue, earnings, margins, and fair value.
On Simply Wall St’s Community page, used by millions of investors, Narratives make this process easy by turning your view on Adecco Group into a structured forecast and a resulting fair value. This allows you to quickly see whether your Narrative suggests the stock is worth more or less than today’s price and therefore whether it might be a buy, hold, or sell.
Because Narratives are dynamic, they automatically refresh when new information arrives, such as earnings updates, major news, or changes in analyst expectations. This means your view stays live instead of becoming a static snapshot.
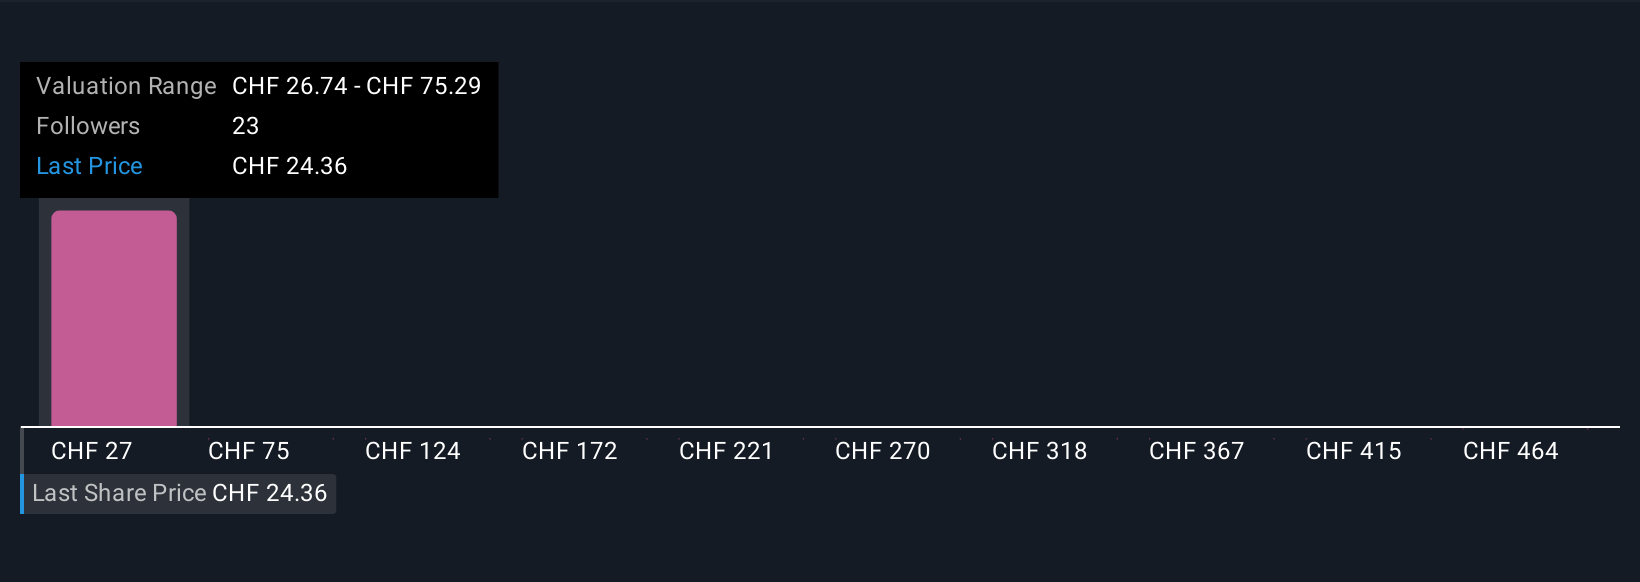
For example, one investor might build a bullish Adecco Narrative closer to the upper analyst price target of about CHF 42.73, assuming AI platforms, upskilling demand, and margin expansion all play out strongly. Another investor could build a more cautious Narrative closer to CHF 18.62 if they think automation, regulatory risks, and margin pressure will limit long term growth. Both investors can then instantly compare their own fair value to the current share price to guide their decisions.
Do you think there's more to the story for Adecco Group? Head over to our Community to see what others are saying!
This article by Simply Wall St is general in nature. We provide commentary based on historical data and analyst forecasts only using an unbiased methodology and our articles are not intended to be financial advice. It does not constitute a recommendation to buy or sell any stock, and does not take account of your objectives, or your financial situation. We aim to bring you long-term focused analysis driven by fundamental data. Note that our analysis may not factor in the latest price-sensitive company announcements or qualitative material. Simply Wall St has no position in any stocks mentioned.
Have feedback on this article? Concerned about the content? Get in touch with us directly. Alternatively, email editorial-team@simplywallst.com