
- PREMIUM
- LIVE QUOTES
 Index Options
 State Street
 CME Group
 Nasdaq
 Cboe
Cboe TradingView
 Wall Street Journal
Does FedEx’s Cost Cutting and DCF Outlook Signal a Missed Opportunity in 2025?
- Wondering if FedEx is quietly turning into a value opportunity while the market is distracted by flashier names? This article is going to unpack whether the current price actually makes sense.
- After a bumpy stretch, FedEx now trades around $270.37, down 1.3% over the last week but still up 6.5% over the past month, with a 66.9% gain over three years despite being slightly negative year to date and over one year.
- Recent headlines have focused on FedEx sharpening its cost structure and streamlining operations to improve margins, while continuing to lean into e-commerce and business-to-business shipping demand. At the same time, investors are watching how FedEx navigates ongoing logistics competition and macro uncertainty. This helps explain the recent push and pull in the share price.
- Right now FedEx scores a 5/6 valuation check score, suggesting the stock screens as undervalued on most of our metrics. Next we will break down what that means across different valuation approaches, before finishing with a more practical way to think about its worth.
Approach 1: FedEx Discounted Cash Flow (DCF) Analysis
A Discounted Cash Flow model estimates what a business is worth today by projecting the cash it can generate in the future and then discounting those cash flows back to the present.
For FedEx, the latest twelve month Free Cash Flow is about $2.6 billion. Analysts and our model expect this to rise steadily, with projections reaching roughly $4.6 billion by 2028 and about $6.4 billion by 2035, as Simply Wall St extrapolates beyond the initial analyst forecast window. These growing cash flows are then discounted using a 2 Stage Free Cash Flow to Equity model to reflect risk and the time value of money.
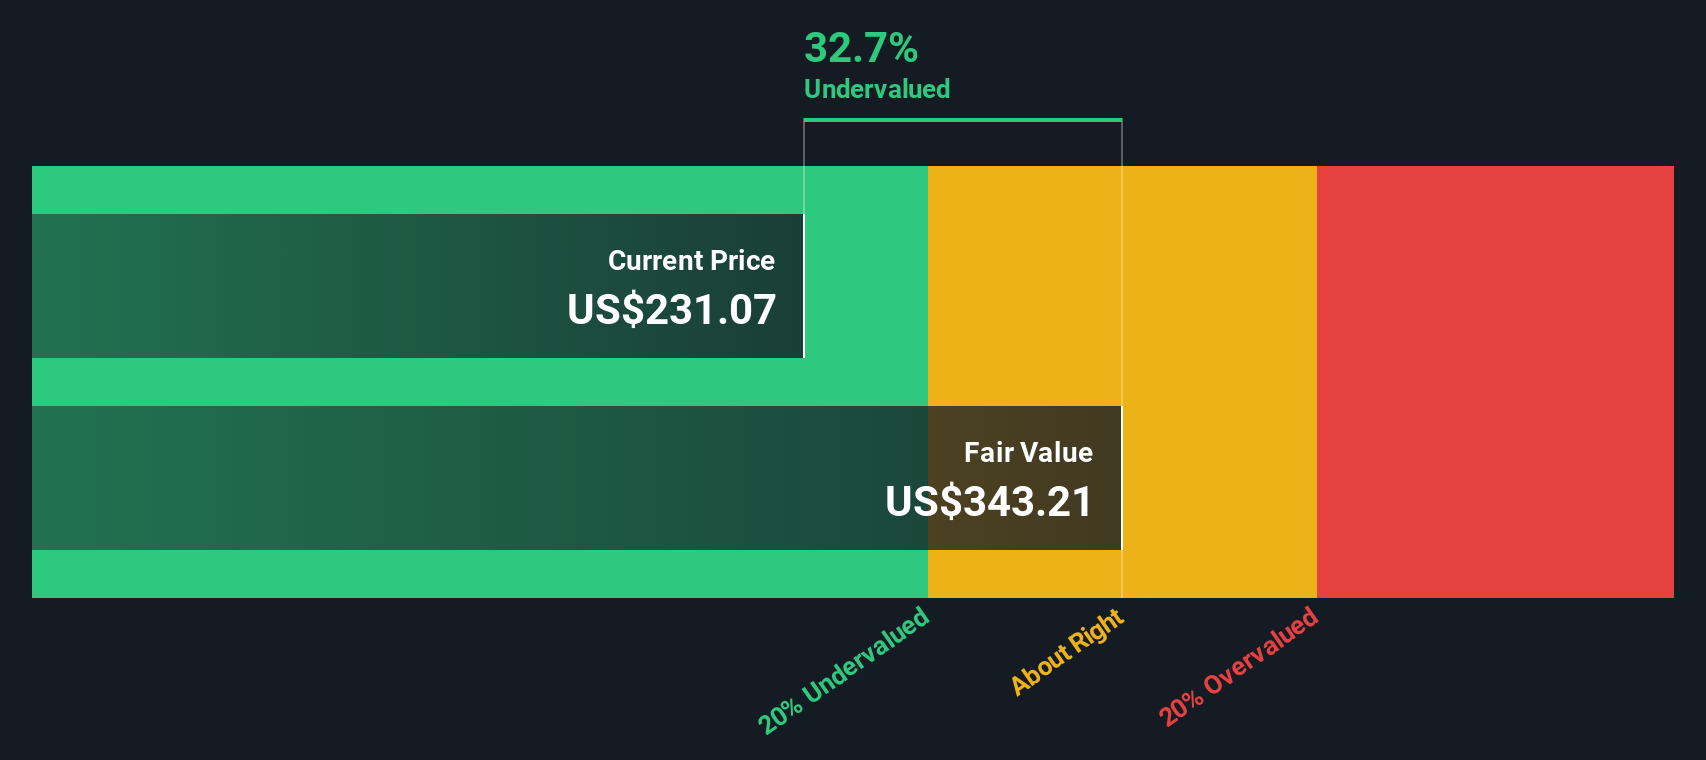
On this basis, one estimate of intrinsic value for FedEx is $347.63 per share, compared with a recent market price of about $270.37. That represents a difference of roughly 22.2% according to this DCF view, indicating a gap between this valuation and the current market price for FedEx, based on the model’s assumptions regarding future cash generation.
Result: UNDERVALUED
Our Discounted Cash Flow (DCF) analysis suggests FedEx is undervalued by 22.2%. Track this in your watchlist or portfolio, or discover 925 more undervalued stocks based on cash flows.
Approach 2: FedEx Price vs Earnings
For a mature, consistently profitable business like FedEx, the Price to Earnings ratio is a practical way to gauge value because it ties the share price directly to the company’s current earning power. Investors typically pay higher PE ratios for companies with stronger growth prospects and lower perceived risk, and accept lower PEs where growth is slower or earnings are more cyclical.
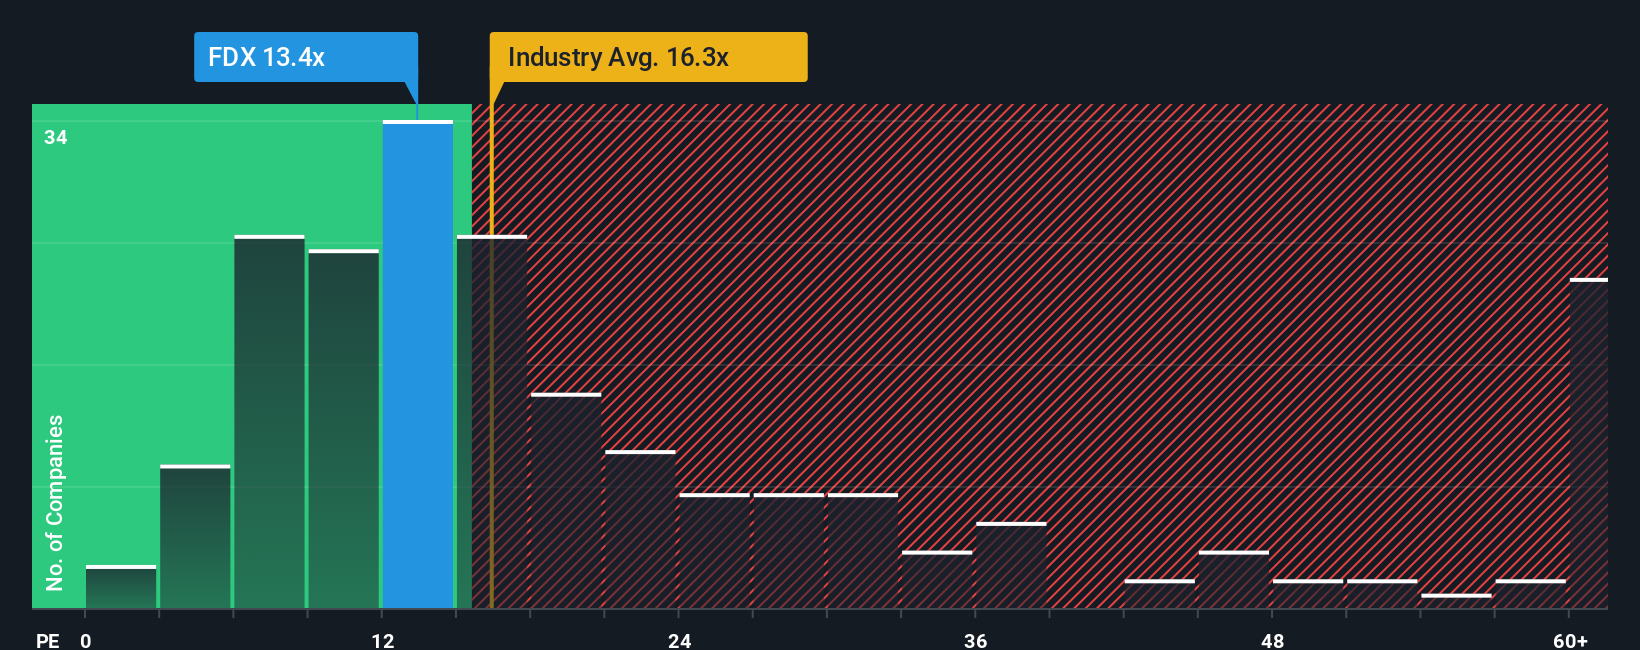
FedEx currently trades on a PE of about 15.5x, slightly below the broader Logistics industry average of roughly 16.1x and well below the peer group average of around 20.6x. Simply Wall St’s Fair Ratio for FedEx is 19.2x, which represents the PE we would expect given its earnings growth profile, margins, industry positioning, market cap and specific risk factors.
This Fair Ratio is more tailored than a simple comparison to peers or industry averages, because it adjusts for FedEx’s own characteristics rather than assuming all logistics stocks deserve the same multiple. Comparing the Fair Ratio of 19.2x with the current PE of 15.5x suggests the market is pricing FedEx at a discount to what its fundamentals warrant.
Result: UNDERVALUED
PE ratios tell one story, but what if the real opportunity lies elsewhere? Discover 1441 companies where insiders are betting big on explosive growth.
Upgrade Your Decision Making: Choose your FedEx Narrative
Earlier we mentioned that there is an even better way to understand valuation, so let us introduce you to Narratives, which are simply the stories investors tell about a company’s future, translated into concrete assumptions about its revenue, earnings, margins and ultimately fair value.
A Narrative links FedEx’s business story, like cost discipline or freight headwinds, to a specific financial forecast and then to a fair value estimate, so you can clearly see how your view of the future maps into a number you would be willing to pay.
On Simply Wall St, millions of investors can access Narratives on the Community page, where this framework is made easy and accessible, showing you how your assumptions compare with others.
Narratives then help you evaluate potential entry or exit points by comparing your Fair Value with the current Price, and they update dynamically as new information like earnings, news or guidance changes the numbers behind the story.
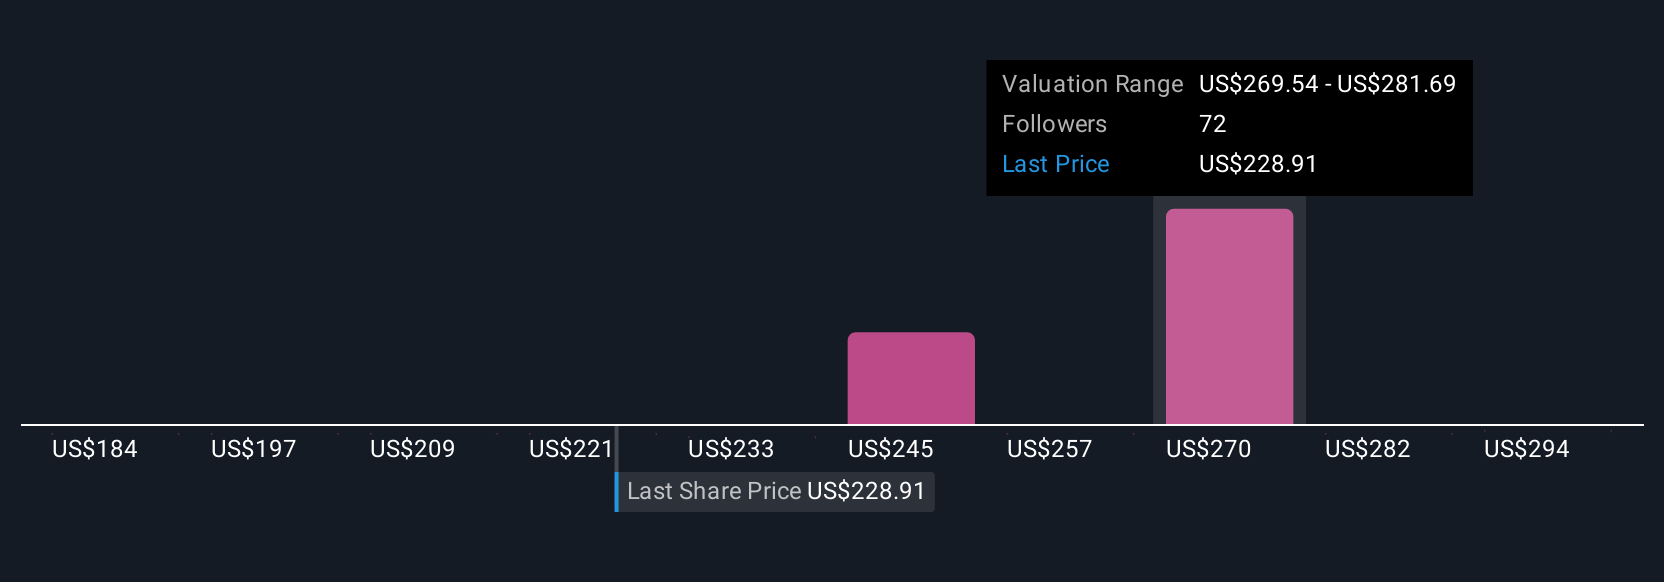
For example, one FedEx investor might build a more optimistic Narrative closer to $320, assuming strong execution on cost savings and network optimization, while another might anchor nearer $200, focusing instead on macro risks, freight pressure and restructuring uncertainty.
Do you think there's more to the story for FedEx? Head over to our Community to see what others are saying!
This article by Simply Wall St is general in nature. We provide commentary based on historical data and analyst forecasts only using an unbiased methodology and our articles are not intended to be financial advice. It does not constitute a recommendation to buy or sell any stock, and does not take account of your objectives, or your financial situation. We aim to bring you long-term focused analysis driven by fundamental data. Note that our analysis may not factor in the latest price-sensitive company announcements or qualitative material. Simply Wall St has no position in any stocks mentioned.
Have feedback on this article? Concerned about the content? Get in touch with us directly. Alternatively, email editorial-team@simplywallst.com