
- PREMIUM
- LIVE QUOTES
- INSTITUTION
 Index Options
 State Street
 CME Group
 Nasdaq
 Cboe
Cboe TradingView
 Wall Street Journal
Is It Too Late To Consider Credo After Its 173.1% AI Driven Surge?
- If you are wondering whether Credo Technology Group Holding is still an attractive opportunity after its large run up, or if you have already missed the boat, you are in the right place to dig into what the current price really implies.
- The stock has surged 14.9% over the last week, 4.3% over the past month, and an eye catching 173.1% over the last year, with an even bigger 1146.3% gain over three years. This naturally raises questions about how much future growth is already reflected in the price.
- Recent headlines have focused on Credo as a key player in high speed connectivity solutions for AI and data center infrastructure, a theme that has drawn strong investor attention. Broader enthusiasm for AI related semiconductor names and networking hardware has likely amplified buying interest, helping to drive those outsized returns.
- Despite all that excitement, Credo currently scores just 0 out of 6 on our valuation checks. In the sections that follow we will unpack what different valuation approaches indicate about the stock and then finish with a more holistic way to think about what it may really be worth.
Credo Technology Group Holding scores just 0/6 on our valuation checks. See what other red flags we found in the full valuation breakdown.
Approach 1: Credo Technology Group Holding Discounted Cash Flow (DCF) Analysis
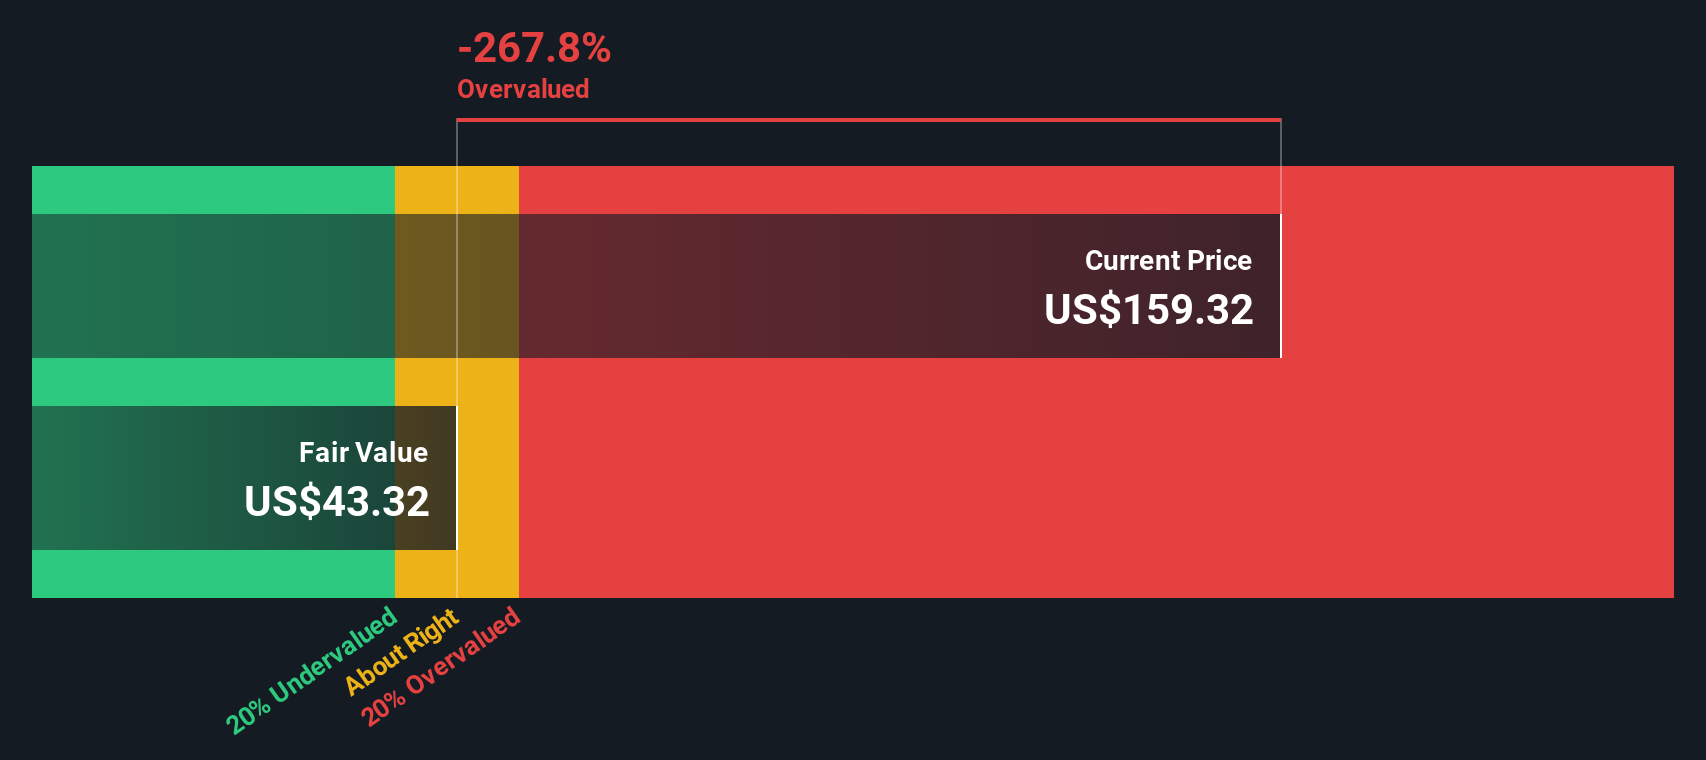
A Discounted Cash Flow, or DCF, model estimates what a company is worth by projecting the cash it could generate in the future and discounting those amounts back to today. For Credo Technology Group Holding, the model starts from last twelve month Free Cash Flow of about $119.7 Million and then applies a two stage Free Cash Flow to Equity approach using analyst forecasts and longer term extrapolations by Simply Wall St.
According to analyst projections, Free Cash Flow is expected to reach $292.3 Million in 2026 and $542.98 Million in 2027, and the model extends this trajectory out to around $1.0 Billion by 2030. When all these future cash flows are discounted back, the DCF implies an intrinsic value of approximately $76.42 per share.
Comparing this estimate with the current market price suggests the stock is about 146.6% overvalued on a DCF basis, which indicates that a significant level of optimistic growth expectations is already reflected in the price.
Result: OVERVALUED
Our Discounted Cash Flow (DCF) analysis suggests Credo Technology Group Holding may be overvalued by 146.6%. Discover 927 undervalued stocks or create your own screener to find better value opportunities.
Approach 2: Credo Technology Group Holding Price vs Sales
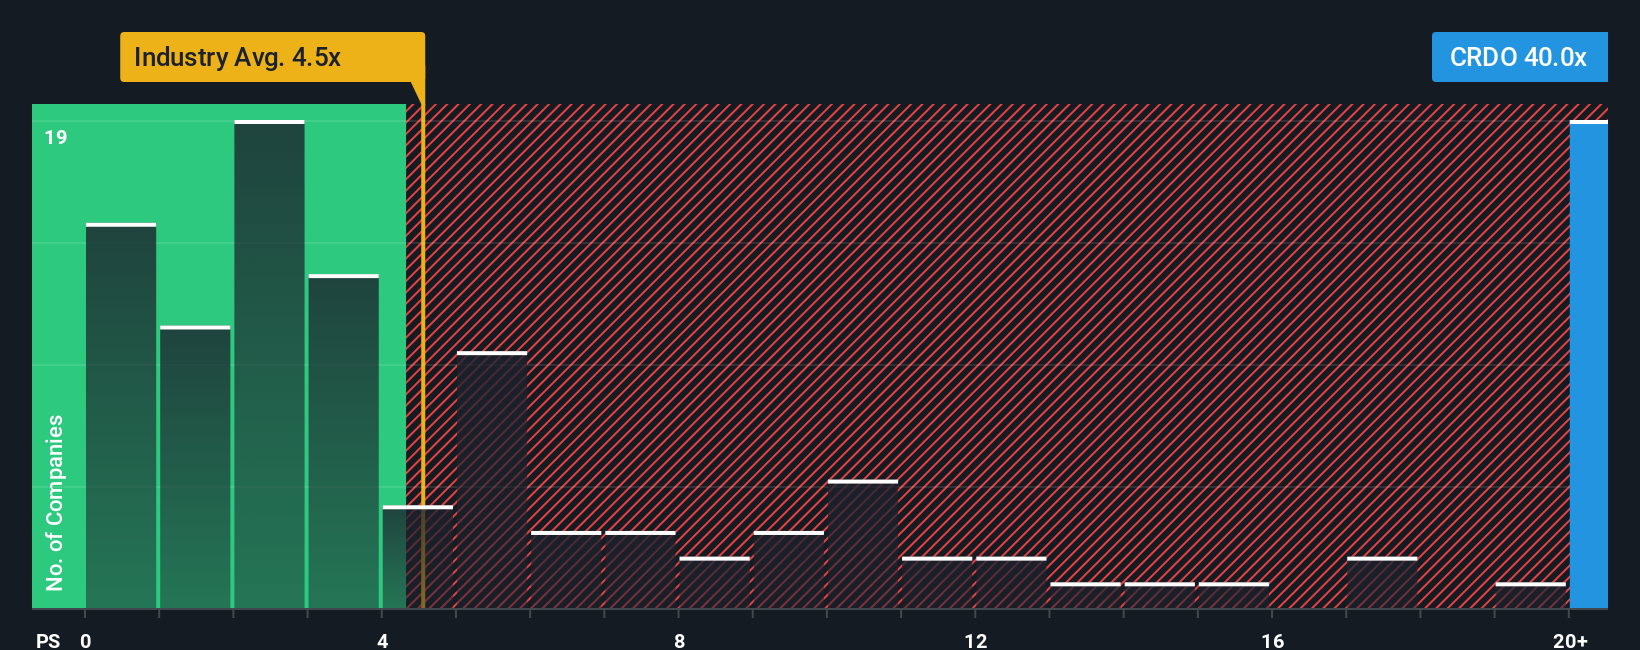
For a business like Credo that is still in a high growth phase, the Price to Sales, or P S, ratio is often a more useful yardstick than earnings based measures, because revenues tend to be more stable while margins and profits can swing around as the company scales.
In general, faster growth and lower perceived risk justify a higher “normal” valuation multiple, while slower growth or higher uncertainty should pull that multiple down. Credo currently trades on a rich P S of about 42.75x, which is far above both the Semiconductor industry average of roughly 5.35x and the average of its closer peers at around 15.15x.
Simply Wall St’s Fair Ratio framework goes a step further by estimating what a reasonable multiple should be after accounting for Credo’s specific growth outlook, profitability, risk profile, industry positioning and market cap. On this basis, Credo’s Fair P S Ratio is about 22.20x, which, while higher than peers and the sector, still sits well below the current market multiple. That gap suggests investors are paying a substantial premium to even optimistic fundamentals.
Result: OVERVALUED
PS ratios tell one story, but what if the real opportunity lies elsewhere? Discover 1440 companies where insiders are betting big on explosive growth.
Upgrade Your Decision Making: Choose your Credo Technology Group Holding Narrative
Earlier we mentioned that there is an even better way to understand valuation, so let us introduce you to Narratives, a simple way for you to attach a clear story to your numbers by setting your own expectations for Credo Technology Group Holding’s future revenue, earnings and margins, linking that story to a financial forecast and fair value estimate, and then easily comparing that fair value to the current share price to decide whether to buy, hold or sell. Narratives on Simply Wall St’s Community page, used by millions of investors, are dynamic, updating automatically as new information like earnings releases or major AI connectivity announcements comes in, so your view is always grounded in the latest data. For example, one Credo Narrative might lean closer to the more cautious $72 price target, stressing concentration risks and slower protocol adoption. Another could align with a more optimistic $140 view, emphasizing secular AI demand, product leadership and expanding hyperscaler relationships. Narratives helps you see precisely how each perspective flows through to a distinct forecast and valuation so you can choose the story that best fits your own assumptions.
Do you think there's more to the story for Credo Technology Group Holding? Head over to our Community to see what others are saying!

This article by Simply Wall St is general in nature. We provide commentary based on historical data and analyst forecasts only using an unbiased methodology and our articles are not intended to be financial advice. It does not constitute a recommendation to buy or sell any stock, and does not take account of your objectives, or your financial situation. We aim to bring you long-term focused analysis driven by fundamental data. Note that our analysis may not factor in the latest price-sensitive company announcements or qualitative material. Simply Wall St has no position in any stocks mentioned.
Have feedback on this article? Concerned about the content? Get in touch with us directly. Alternatively, email editorial-team@simplywallst.com