
- PREMIUM
- LIVE QUOTES
- INSTITUTION
 Index Options
 State Street
 CME Group
 Nasdaq
 Cboe
Cboe TradingView
 Wall Street Journal
Does DraftKings Recent Bounce Reflect Its Long Term Value Potential in 2025?
- Wondering if DraftKings at around $33 a share is a bargain or a bubble? This article will walk through whether the current price really matches the company’s long term potential.
- Despite being down 24.9% over the last year and 7.4% year to date, the stock has bounced 9.9% over the past month and 4.4% in the last week, hinting that sentiment might be turning again after a rough stretch.
- Recent headlines have focused on DraftKings expanding its footprint as more U.S. states open up to online sports betting and iGaming, and on the company aggressively rolling out new product features to deepen user engagement. At the same time, increased competition and ongoing regulatory scrutiny keep volatility high, which helps explain the sharp swings in the share price.
- Right now DraftKings scores a 3/6 valuation check score, suggesting the market may not be fully pricing in its fundamentals. Next, we will break down what that means across different valuation approaches, before finishing with a more nuanced way to think about fair value than simple multiples or models alone.
Find out why DraftKings's -24.9% return over the last year is lagging behind its peers.
Approach 1: DraftKings Discounted Cash Flow (DCF) Analysis
A Discounted Cash Flow model estimates what a business is worth by projecting the cash it can generate in the future and discounting those cash flows back to today in dollar terms.
For DraftKings, the model starts with last twelve month free cash flow of about $513.6 Million and uses a 2 Stage Free Cash Flow to Equity framework. Analysts provide detailed estimates for the next few years, and after that Simply Wall St extrapolates the trend. On this basis, free cash flow is projected to climb to roughly $3.8 Billion by 2035, reflecting strong expected scaling of the platform as more users and states come online.
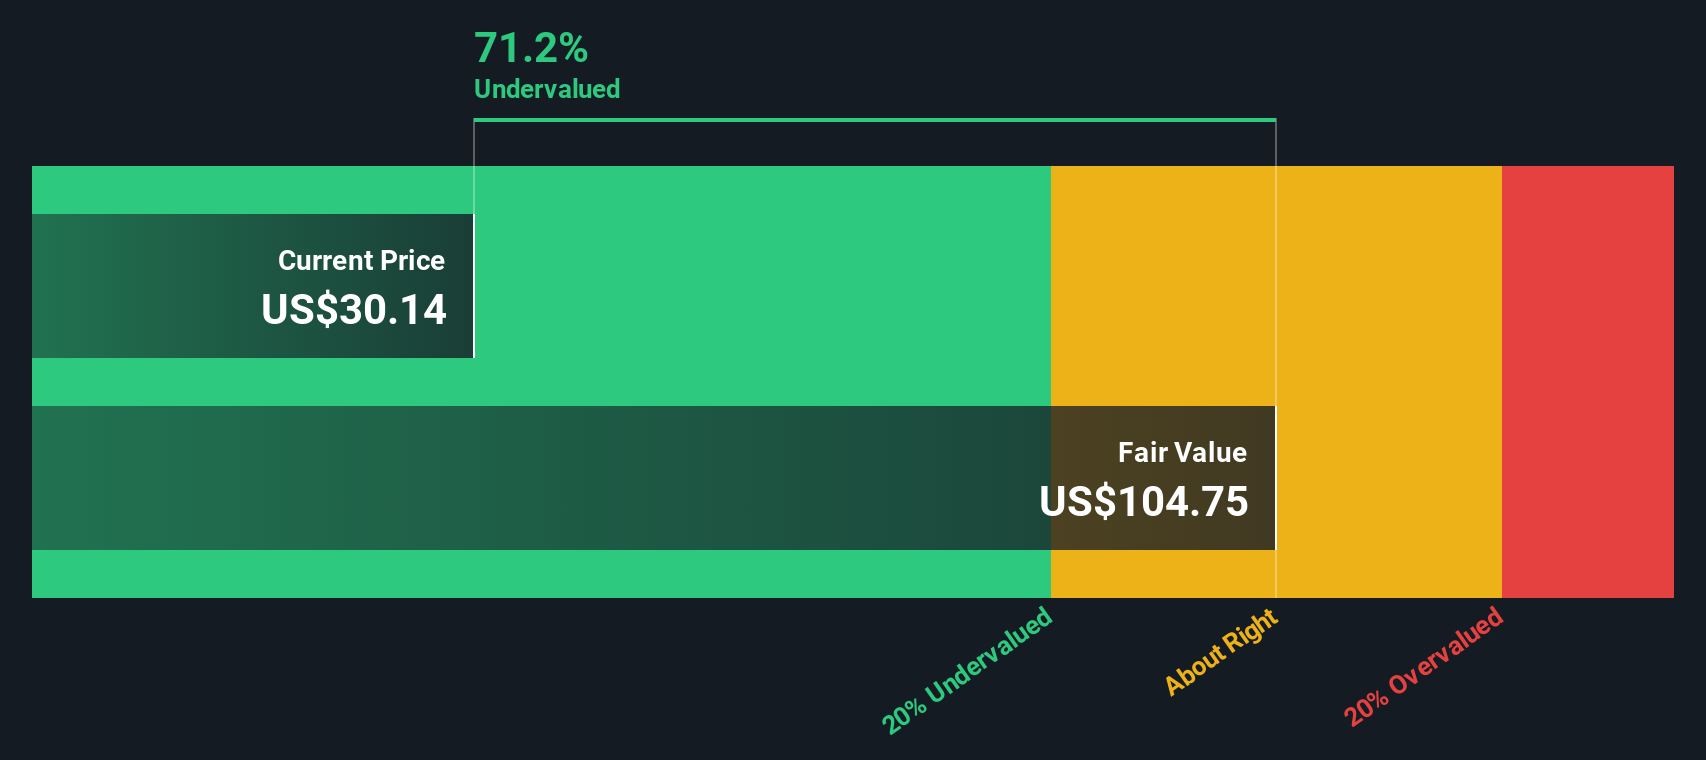
When all these projected cash flows are discounted back, the DCF model arrives at an intrinsic value of about $96.11 per share. Compared with the current price around $33, that implies DraftKings trades at roughly a 65% discount to its estimated fair value. This suggests the market remains highly skeptical about the durability of this growth path.
Result: UNDERVALUED
Our Discounted Cash Flow (DCF) analysis suggests DraftKings is undervalued by 65.0%. Track this in your watchlist or portfolio, or discover 933 more undervalued stocks based on cash flows.
Approach 2: DraftKings Price vs Sales
For companies like DraftKings that are still prioritizing scale over bottom line profits, the Price to Sales ratio is often a more practical yardstick than earnings-based measures, because revenue is less distorted by heavy investment and accounting losses.
In theory, the higher a company’s growth prospects and the lower its perceived risk, the higher the “normal” or “fair” multiple investors are willing to pay for each dollar of sales. Conversely, slower growth or greater regulatory and competitive risk should pull that multiple down.
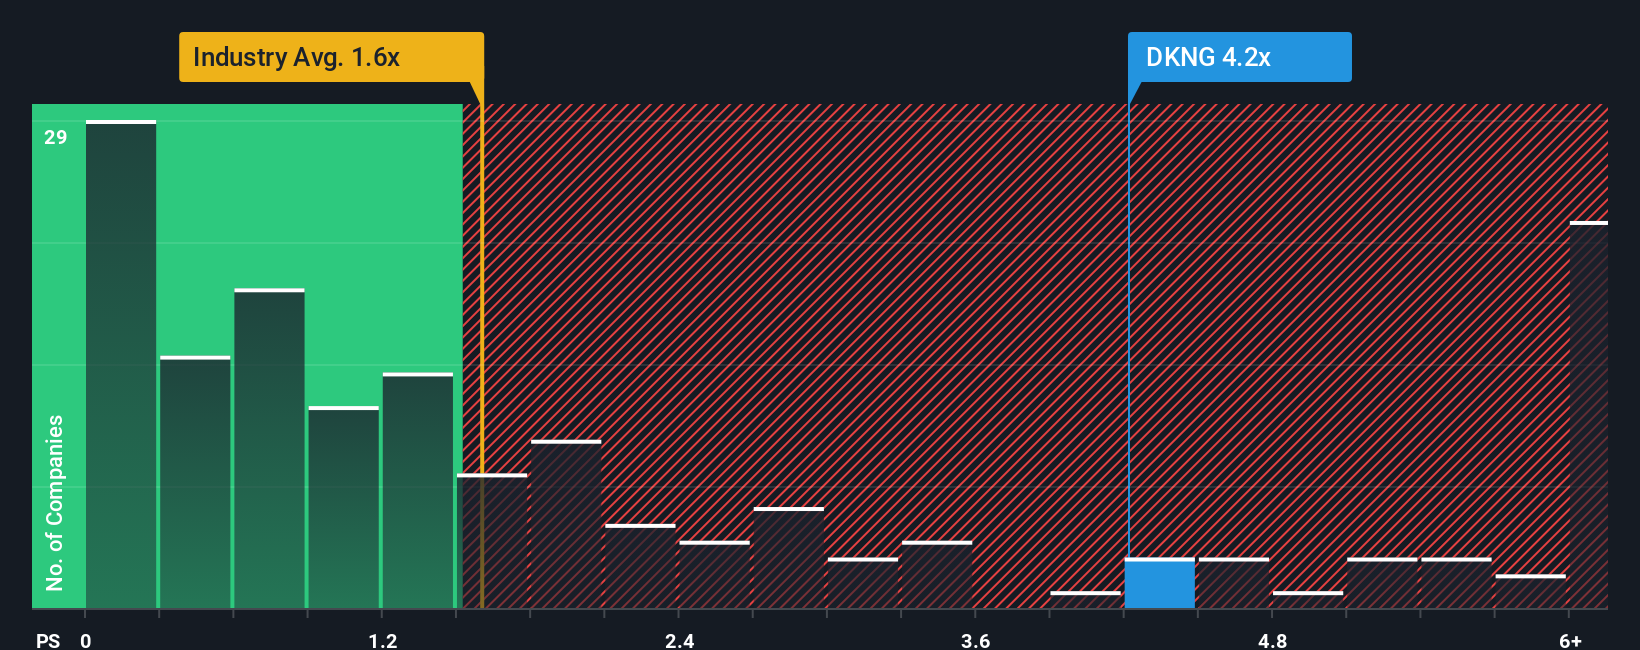
DraftKings currently trades on a Price to Sales ratio of about 3.07x. That sits above both the Hospitality industry average of roughly 1.65x and the peer group average of around 2.24x. This implies investors already pay a premium for its growth story. Simply Wall St’s Fair Ratio framework estimates what a reasonable multiple should be, given DraftKings growth, margins, risk profile, industry and market cap, arriving at a Fair Ratio of about 3.30x. This approach is more informative than simple peer or industry comparisons because it adjusts for the company’s specific fundamentals rather than treating all operators as equal. With the current 3.07x sitting slightly below the 3.30x Fair Ratio, the stock appears modestly undervalued on a sales basis.
Result: UNDERVALUED
PS ratios tell one story, but what if the real opportunity lies elsewhere? Discover 1440 companies where insiders are betting big on explosive growth.
Upgrade Your Decision Making: Choose your DraftKings Narrative
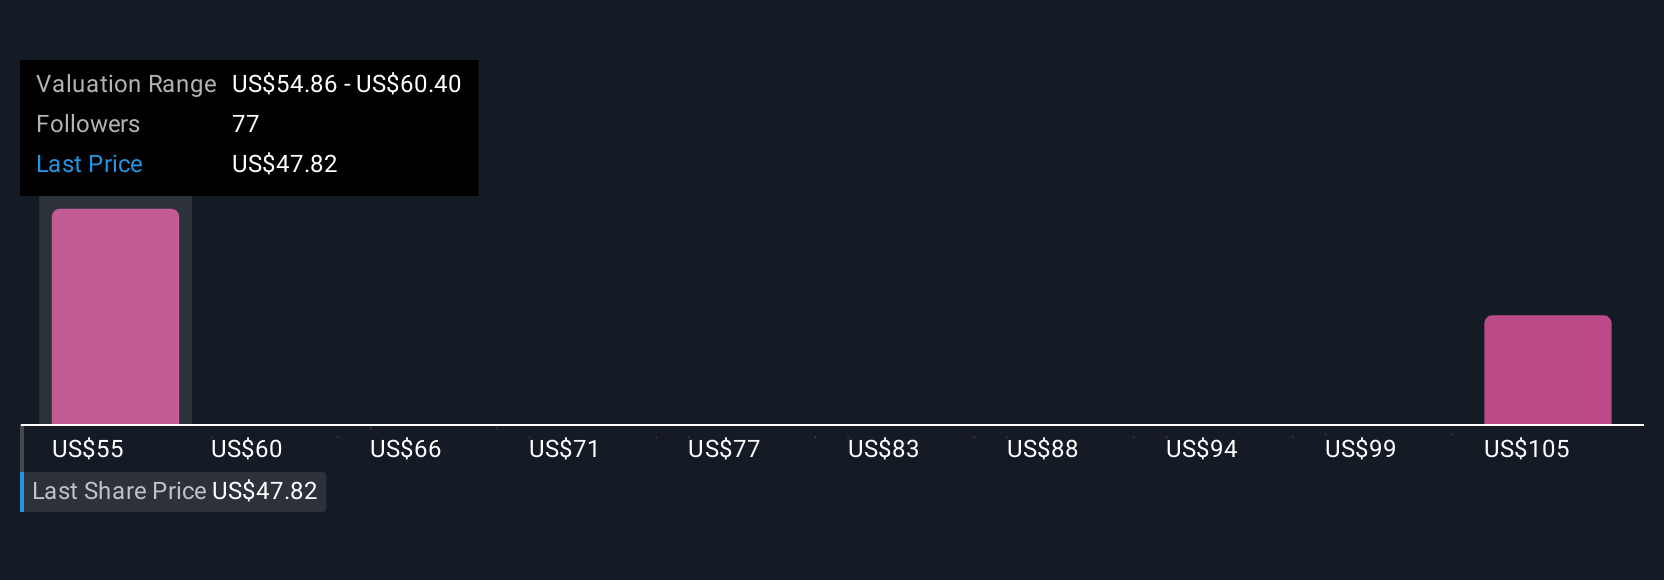
Earlier we mentioned that there is an even better way to understand valuation, so let us introduce you to Narratives, an easy tool on Simply Wall St’s Community page that lets you connect your story about a company with a concrete forecast and a Fair Value estimate. A Narrative is simply your view of how DraftKings future could play out, expressed through assumptions about revenue growth, profit margins, and valuation multiples. These assumptions are then translated into projected financials and a single Fair Value number you can compare to today’s share price to help guide your decisions. Because Narratives on the platform are updated dynamically as new earnings, news and regulatory developments come in, they help you keep your view current without rebuilding a model from scratch. For example, one DraftKings Narrative might lean bullish, assuming faster state legalization and margin expansion to support a Fair Value closer to the high analyst target of about $78. In contrast, a more cautious Narrative could focus on tax and competition risks and land nearer the low target around $39.5, illustrating how different but structured perspectives can coexist around the same stock.
Do you think there's more to the story for DraftKings? Head over to our Community to see what others are saying!
This article by Simply Wall St is general in nature. We provide commentary based on historical data and analyst forecasts only using an unbiased methodology and our articles are not intended to be financial advice. It does not constitute a recommendation to buy or sell any stock, and does not take account of your objectives, or your financial situation. We aim to bring you long-term focused analysis driven by fundamental data. Note that our analysis may not factor in the latest price-sensitive company announcements or qualitative material. Simply Wall St has no position in any stocks mentioned.
Have feedback on this article? Concerned about the content? Get in touch with us directly. Alternatively, email editorial-team@simplywallst.com