
- PREMIUM
- LIVE QUOTES
 Index Options
 State Street
 CME Group
 Nasdaq
 Cboe
Cboe TradingView
 Wall Street Journal
Has Cboe’s 29% 2025 Surge Already Priced In Its Derivatives Growth Story?
- If you are wondering whether Cboe Global Markets is still worth buying after its big run, or if you are late to the party, this breakdown will help you decide whether the current price still makes sense.
- The stock is down 1.2% over the last week but up 3.5% over the past month. Its 29.5% year to date gain, 21.3% 1 year return, and substantial 105.8% and 198.6% returns over 3 and 5 years indicate that the market has been steadily re rating the business.
- Recently, investors have been focused on Cboe expanding its derivatives and options footprint and deepening its presence in higher growth areas such as volatility products and digital trading infrastructure. At the same time, regulatory developments and rising options volumes have kept exchanges and market structure players such as Cboe firmly in the spotlight.
- Despite that backdrop, Cboe only scores a 1 out of 6 on our valuation checks. This suggests that on most traditional metrics the stock may already be pricing in a lot of good news. Next, we will walk through the key valuation methods behind that score before finishing with a more nuanced way to think about what Cboe is really worth.
Cboe Global Markets scores just 1/6 on our valuation checks. See what other red flags we found in the full valuation breakdown.
Approach 1: Cboe Global Markets Excess Returns Analysis
The Excess Returns model looks at how much value Cboe Global Markets can create above the return investors require, based on its profitability and growth in book value per share. Rather than focusing on short term earnings, it asks whether management can keep generating strong returns on the equity invested in the business.
For Cboe, the key inputs are encouraging. The company has an average return on equity of 21.29%, comfortably above its implied cost of equity of $4.53 per share. This translates into an excess return of $7.20 per share, supported by stable earnings power of about $11.73 per share and a rising stable book value estimated at $55.12 per share, up from today’s book value of $46.68. These figures are based on forward looking analyst assumptions about both returns on equity and book value growth.
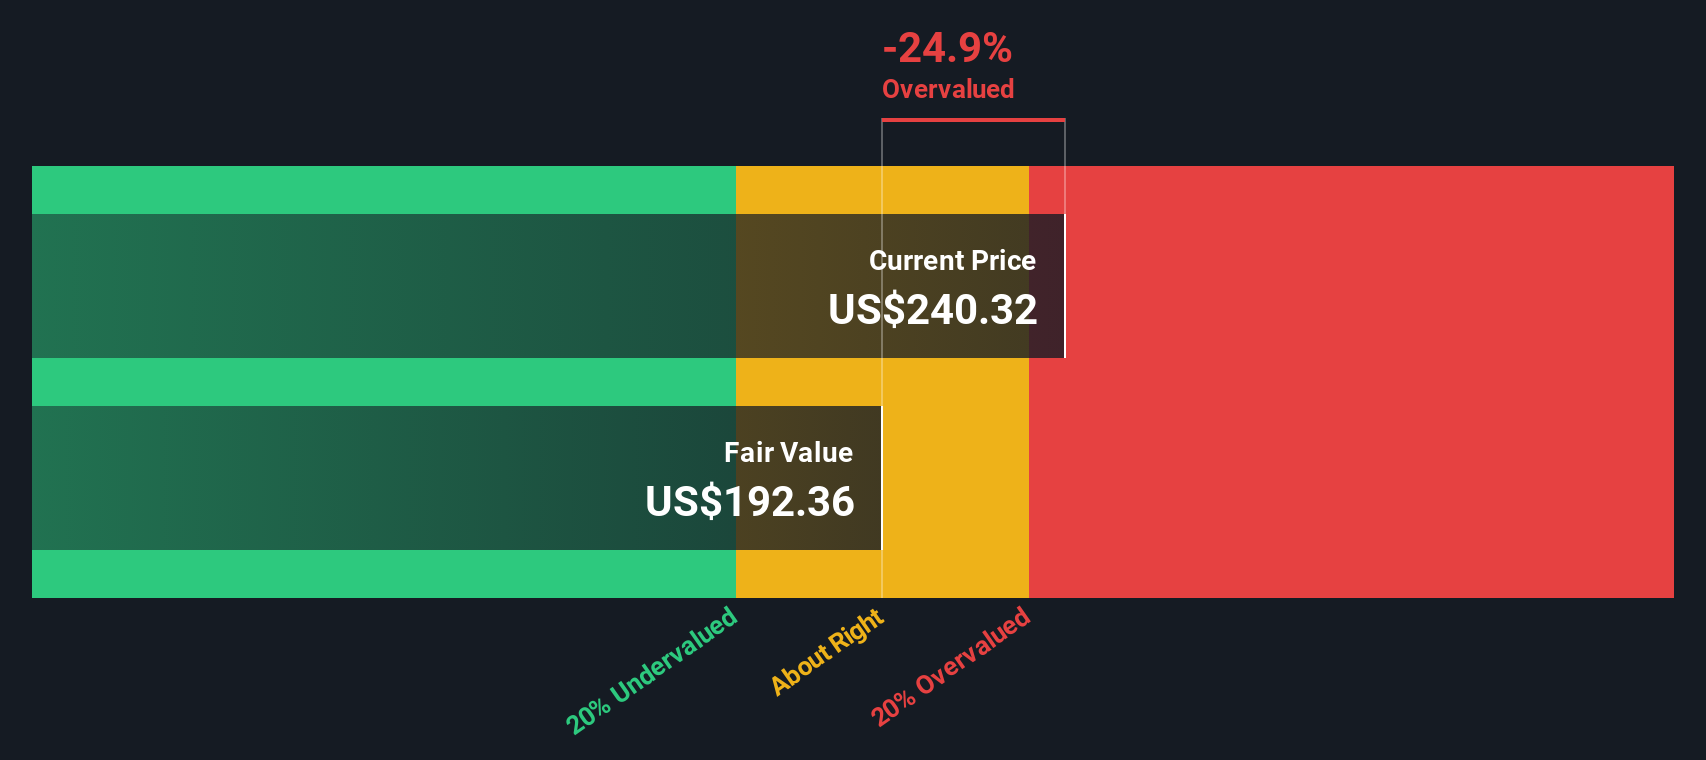
Using these excess returns over time, the model arrives at an intrinsic value of roughly $200.22 per share. With the Excess Returns valuation implying the stock is about 27.0% overvalued relative to its current price, Cboe appears richly priced on this framework.
Result: OVERVALUED
Our Excess Returns analysis suggests Cboe Global Markets may be overvalued by 27.0%. Discover 932 undervalued stocks or create your own screener to find better value opportunities.
Approach 2: Cboe Global Markets Price vs Earnings
For a profitable business like Cboe, the price to earnings ratio is a straightforward way to gauge whether investors are paying a reasonable price for each dollar of earnings. In general, companies with faster, more reliable growth and lower perceived risk can justify a higher PE ratio, while slower growing or riskier firms should trade on lower multiples.
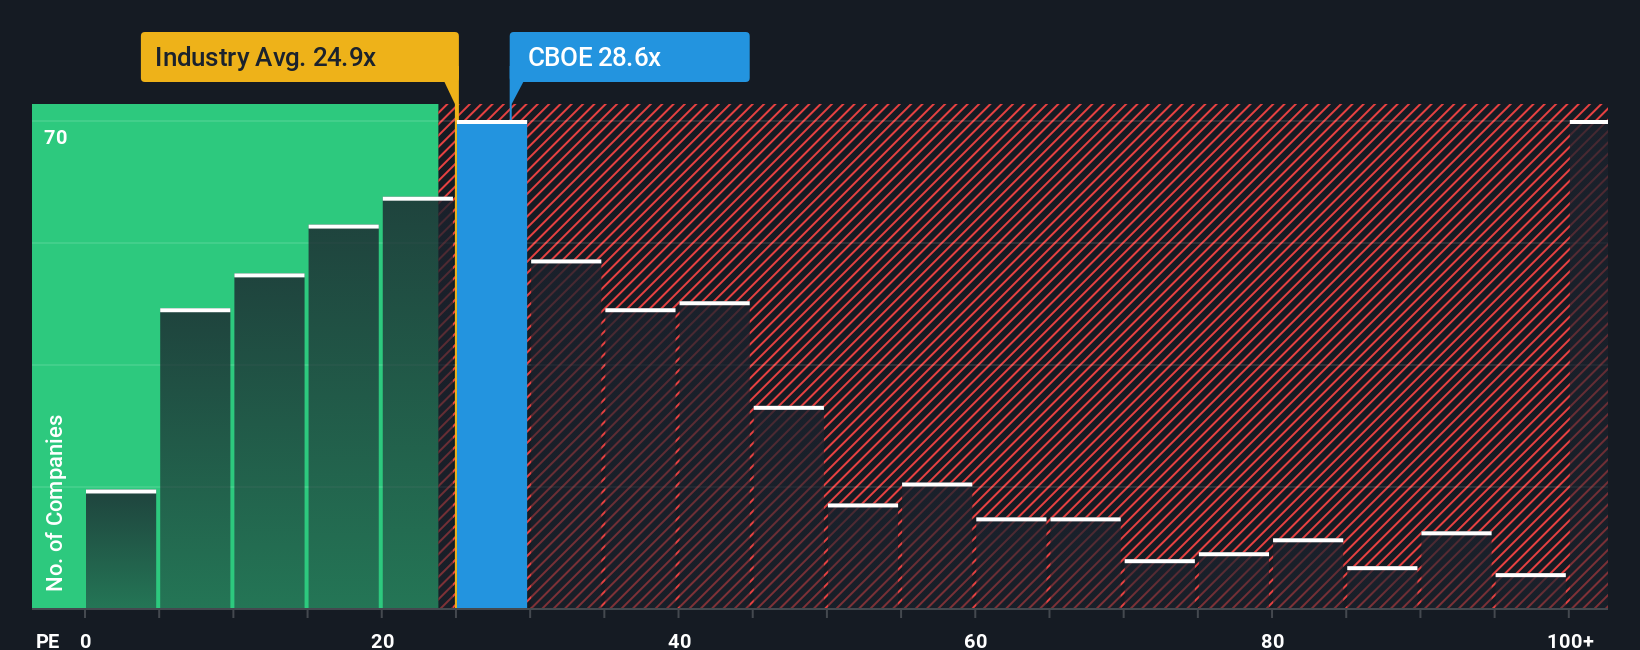
Cboe currently trades on a PE of about 27.2x, which is higher than both the broader Capital Markets industry average of roughly 23.6x and its peer group average of about 29.5x. To go a step further, Simply Wall St uses a proprietary “Fair Ratio” framework, which estimates what a reasonable PE should be after adjusting for Cboe’s specific earnings growth outlook, profitability, industry positioning, market cap and risk profile. For Cboe, that Fair Ratio is around 14.5x.
Because the Fair Ratio incorporates company specific drivers rather than just broad peer or industry comparisons, it offers a more tailored view of value. With Cboe’s actual PE of 27.2x sitting well above the 14.5x Fair Ratio, the shares appear meaningfully overvalued on this metric.
Result: OVERVALUED
PE ratios tell one story, but what if the real opportunity lies elsewhere? Discover 1440 companies where insiders are betting big on explosive growth.
Upgrade Your Decision Making: Choose your Cboe Global Markets Narrative
Earlier we mentioned that there is an even better way to understand valuation, so let us introduce you to Narratives, a simple framework on Simply Wall St’s Community page where you connect your view of a company’s story to a financial forecast and then to a fair value so you can clearly see whether you believe Cboe Global Markets is worth more or less than its current price.
In practice, a Narrative lets you spell out why you think Cboe’s derivatives expansion, data services and global growth will play out a certain way, translate that story into assumptions for future revenue, earnings and margins, and then compare the resulting Fair Value to today’s share price to decide if it aligns with a buy, hold or sell view for you.
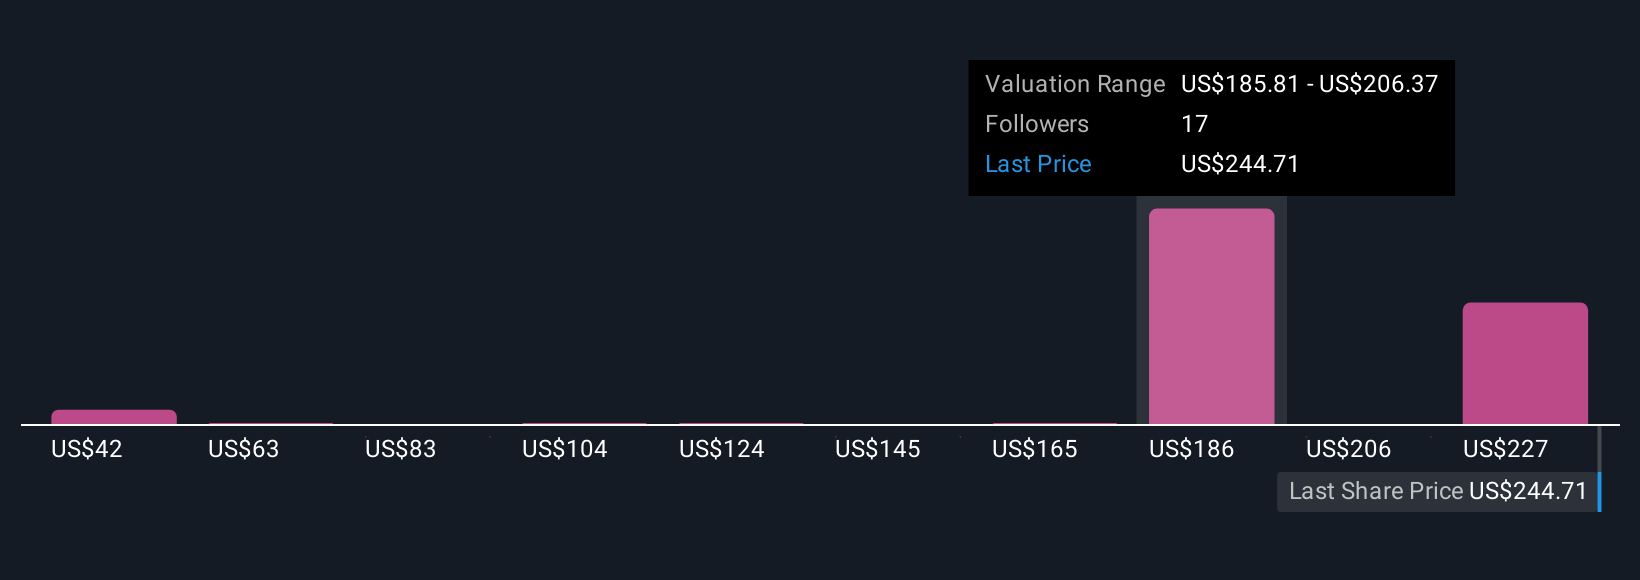
Because Narratives on the platform are updated dynamically when new information such as earnings releases, product launches or regulatory headlines arrive, you can quickly see how the community’s fair value range, from more cautious views closer to the lowest analyst target of about $216 to more optimistic perspectives nearer the highest target around $265, shifts over time and where your own conviction fits in that spectrum.
Do you think there's more to the story for Cboe Global Markets? Head over to our Community to see what others are saying!
This article by Simply Wall St is general in nature. We provide commentary based on historical data and analyst forecasts only using an unbiased methodology and our articles are not intended to be financial advice. It does not constitute a recommendation to buy or sell any stock, and does not take account of your objectives, or your financial situation. We aim to bring you long-term focused analysis driven by fundamental data. Note that our analysis may not factor in the latest price-sensitive company announcements or qualitative material. Simply Wall St has no position in any stocks mentioned.
Have feedback on this article? Concerned about the content? Get in touch with us directly. Alternatively, email editorial-team@simplywallst.com