
- PREMIUM
- LIVE QUOTES
- INSTITUTION
 Index Options
 State Street
 CME Group
 Nasdaq
 Cboe
Cboe TradingView
 Wall Street Journal
Is It Too Late To Consider Medtronic After Its Strong 2025 Share Price Rally?
- If you have been wondering whether Medtronic is still a solid buy at current levels, you are not alone. This is exactly the kind of stock where valuation really matters.
- After drifting 2.8% lower over the last week, Medtronic is still up 13.1% over 30 days, 27.2% year to date and 23.5% over the last year, a pattern that hints investors are reassessing both its growth prospects and its risk profile.
- Those gains have come as investors refocus on large, diversified medical device companies like Medtronic, which are seen as structural winners from aging demographics and ongoing demand for critical procedures. At the same time, renewed interest in quality healthcare names has made some investors question whether the stock has quietly moved from overlooked opportunity to fairly, or even fully, valued.
- On our framework, Medtronic scores a 4/6 valuation check score, suggesting it screens as undervalued on most, but not all, of the key metrics. In the sections that follow we will walk through multiple valuation approaches, before finishing with a more nuanced way to think about what the market is really pricing in.
Approach 1: Medtronic Discounted Cash Flow (DCF) Analysis
A Discounted Cash Flow model estimates what a company is worth by projecting the cash it can generate in the future and then discounting those cash flows back to today in dollar terms. For Medtronic, the 2 Stage Free Cash Flow to Equity model starts with last twelve months free cash flow of about $5.3 billion and then layers on analyst expectations for the next few years, followed by more conservative long term growth assumptions.
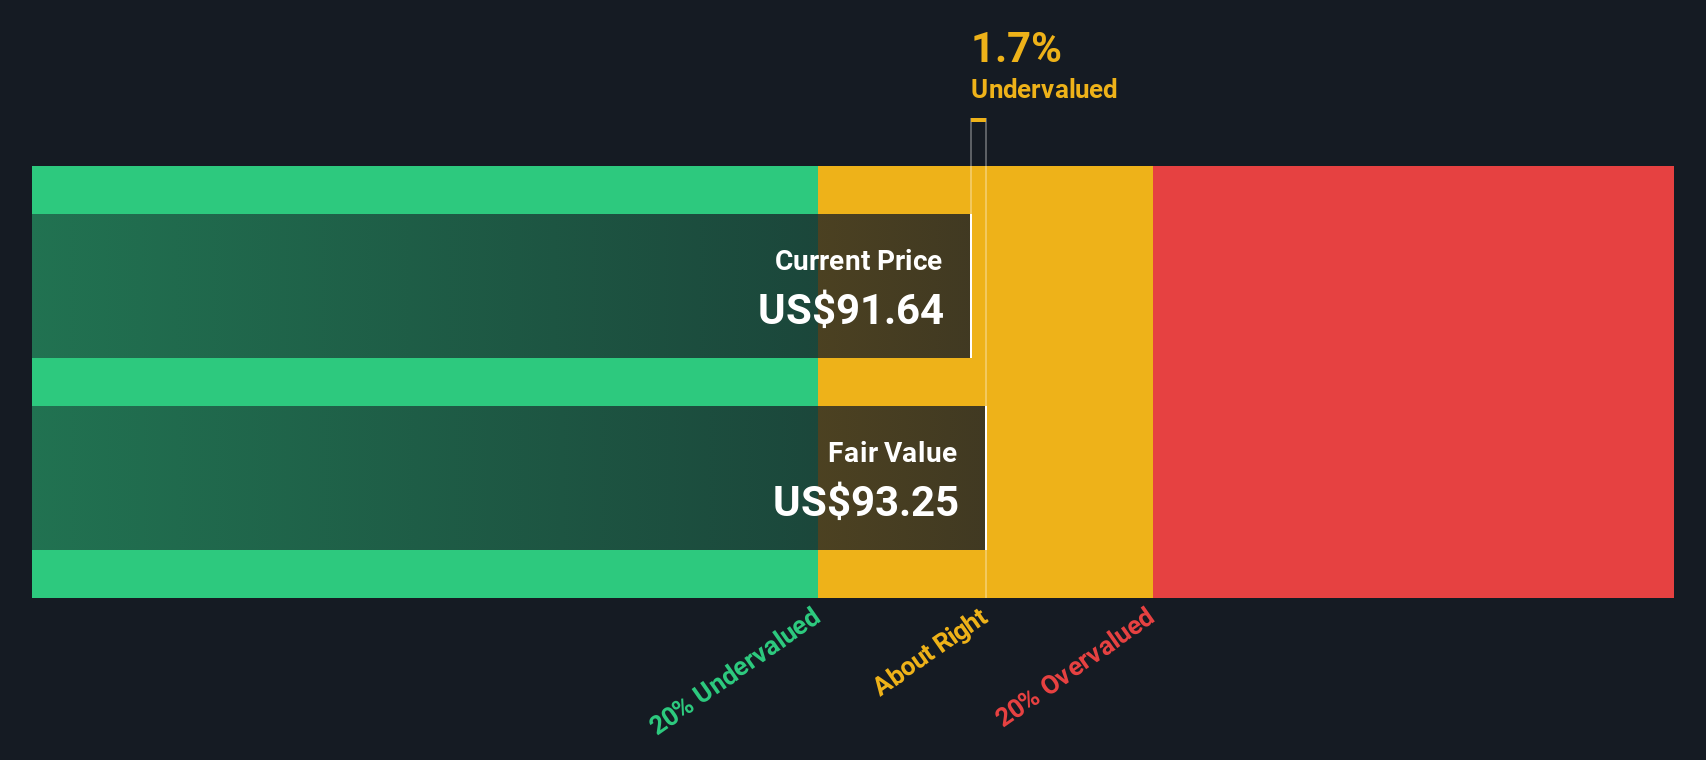
Analysts project free cash flow rising to around $5.8 billion in 2026 and $6.6 billion in 2027, with Simply Wall St extrapolating this trend toward roughly $10.2 billion by 2035 as growth naturally tapers. These future cash flows are then discounted back to today to reflect risk and the time value of money, producing an estimated intrinsic value of about $104 per share.
With the DCF implying Medtronic is only 1.9% undervalued relative to its current share price, the model suggests the market is largely pricing the stock in line with its long term cash generation potential.
Result: ABOUT RIGHT
Medtronic is fairly valued according to our Discounted Cash Flow (DCF), but this can change at a moment's notice. Track the value in your watchlist or portfolio and be alerted on when to act.
Approach 2: Medtronic Price vs Earnings
For a profitable, mature business like Medtronic, the price to earnings ratio is a straightforward way to see what investors are willing to pay for each dollar of current profits. In general, companies with faster, more reliable earnings growth and lower risk deserve higher PE ratios, while slower growing or riskier firms typically trade on lower multiples.
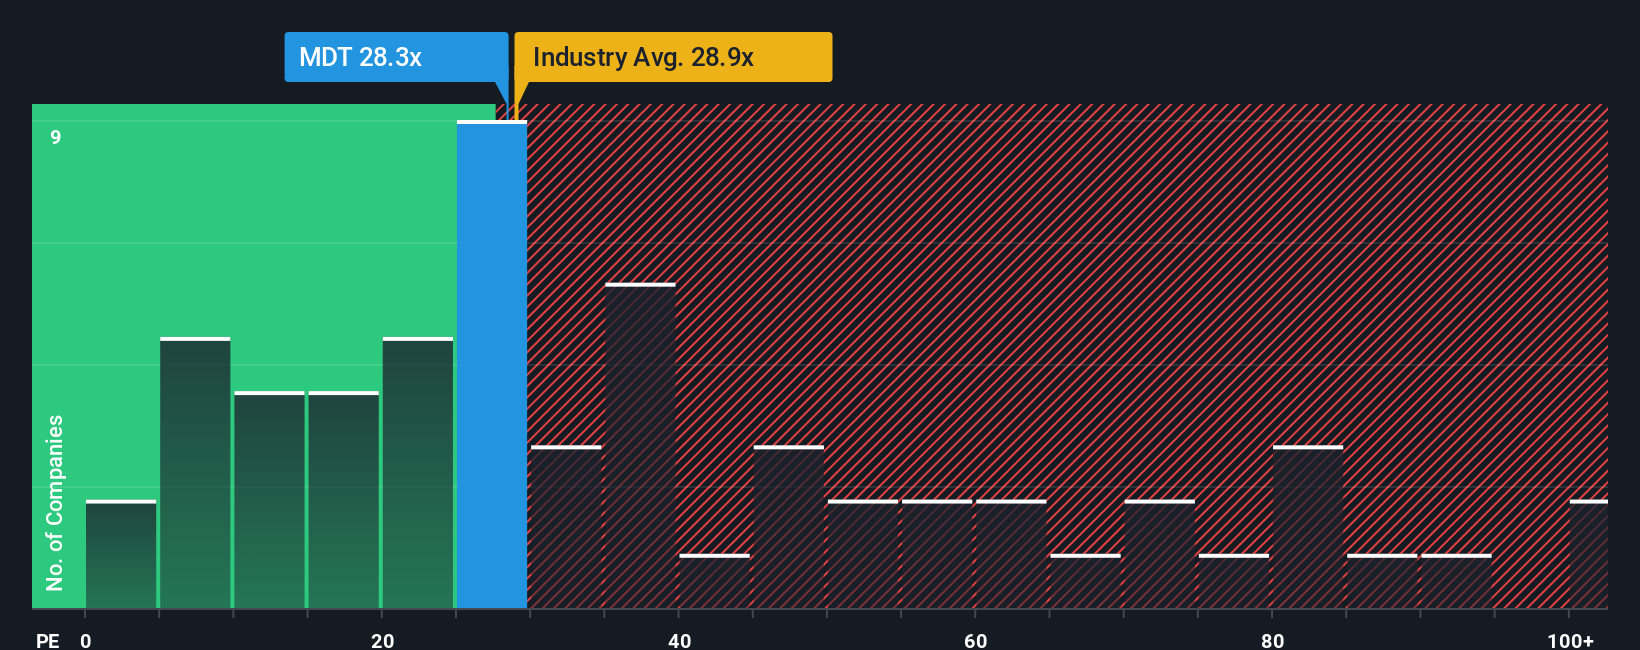
Medtronic currently trades on a PE of about 27.5x, which sits slightly below the broader Medical Equipment industry average of roughly 28.6x and well below the peer group average of around 47.3x. Simply Wall St also calculates a proprietary Fair Ratio of about 32.1x for Medtronic, which reflects what its PE might be based on its specific mix of earnings growth, margins, industry, market cap and risk profile.
This Fair Ratio is more tailored than a simple comparison with peers or the industry, because it adjusts for Medtronic’s own fundamentals rather than assuming all companies deserve the same multiple. With the stock trading on 27.5x versus a Fair Ratio of 32.1x, Medtronic screens as modestly undervalued on a PE basis.
Result: UNDERVALUED
PE ratios tell one story, but what if the real opportunity lies elsewhere? Discover 1441 companies where insiders are betting big on explosive growth.
Upgrade Your Decision Making: Choose your Medtronic Narrative
Earlier we mentioned that there is an even better way to understand valuation, so let us introduce you to Narratives, a simple way to attach your own story about a company to the numbers you think are reasonable for its future revenue, earnings, margins and fair value.
A Narrative connects three things in one place: what you believe is happening in the business, how that translates into a financial forecast, and what you think the stock is actually worth based on those assumptions.
On Simply Wall St, Narratives are easy to use and live inside the Community page, where millions of investors can see how different stories about the same company lead to different fair values and expectations.
Each Narrative turns your view into a practical decision tool by comparing its Fair Value to the current Price, helping you decide whether Medtronic looks like a buy, a hold or a potential sell at today’s levels.
Narratives also update dynamically as new information like earnings, news or guidance is released, so your Medtronic view stays alive rather than locked in a static snapshot. You can see, for example, how one investor’s more cautious fair value near $95 compares to another’s more optimistic view closer to $110 as fresh data comes in.
For Medtronic however, we will make it really easy for you with previews of two leading Medtronic Narratives:
Fair value: $109.82 per share
Implied undervaluation: 7.1%
Forecast revenue growth: 5.79%
- Assumes that accelerating demand from chronic disease treatments and innovation in digital health, robotics and AI enabled devices will drive steady top line growth and potential market share gains.
- Expects restructuring, the Diabetes separation and efficiency initiatives to support margins and earnings, underpinned by a deep pipeline across cardiovascular, neuromodulation and other high value franchises.
- Highlights risks around margin pressure, underperforming segments and execution on major new product ramps and the Diabetes spin off, which could limit potential upside if they do not go to plan.
Fair value: $95.00 per share
Implied overvaluation: 7.4%
Forecast revenue growth: 5.15%
- Recognizes Medtronic’s diversified portfolio, R&D spend and global footprint as key strengths, with robotics, neuromodulation and diabetes devices providing possible longer term growth avenues.
- Argues that regulatory hurdles, product recalls, intense competition in cardiovascular, robotics and diabetes, and macro factors like currency volatility and supply chain risk could limit profitability.
- Concludes that, despite cash flows and a long dividend track record, execution and competitive pressures support a lower fair value than today’s share price.
Do you think there's more to the story for Medtronic? Head over to our Community to see what others are saying!

This article by Simply Wall St is general in nature. We provide commentary based on historical data and analyst forecasts only using an unbiased methodology and our articles are not intended to be financial advice. It does not constitute a recommendation to buy or sell any stock, and does not take account of your objectives, or your financial situation. We aim to bring you long-term focused analysis driven by fundamental data. Note that our analysis may not factor in the latest price-sensitive company announcements or qualitative material. Simply Wall St has no position in any stocks mentioned.
Have feedback on this article? Concerned about the content? Get in touch with us directly. Alternatively, email editorial-team@simplywallst.com