
- PREMIUM
- LIVE QUOTES
 Index Options
 State Street
 CME Group
 Nasdaq
 Cboe
Cboe TradingView
 Wall Street Journal
Should You Pay Attention to Synchrony Stock After 19.6% Jump in 2025?
- Wondering if Synchrony Financial is worth your attention right now? You are not alone, especially with investors keenly debating whether it still has room to run.
- The stock recently closed at $78.05 after rising 2.0% over the past week and delivering an impressive 19.6% return year-to-date. This suggests both growth potential and shifting perceptions of risk.
- Recent headlines surrounding Synchrony Financial highlight ongoing partnerships and innovative credit offerings, which appear to be adding momentum to its growth narrative. Developments such as new agreements with major retailers and advances in digital banking have also contributed to the recent share price enthusiasm.
- On valuation, Synchrony scores a 5 out of 6 on our valuation checklist, suggesting it stands out in several key areas. However, there is still one metric holding it back from a perfect score. We will discuss those traditional valuation approaches in a moment, along with a more holistic way to understand the true value behind the numbers.
Approach 1: Synchrony Financial Excess Returns Analysis
The Excess Returns model evaluates a company's value by examining how much return it generates on its investments compared to the baseline cost of capital. This method is particularly insightful for financial institutions like Synchrony Financial, where consistent returns on shareholders' equity can signal long-term value creation.
For Synchrony Financial, the notable data points from this model include a Book Value of $43.99 per share and a Stable EPS forecast of $10.04 per share, based on projected future Return on Equity from 12 analysts. The company’s Cost of Equity stands at $4.58 per share, while its annual Excess Return amounts to $5.46 per share. Synchrony’s Average Return on Equity is a robust 19.69 percent, and the Stable Book Value is expected to rise to $51.00 per share (based on estimates from 10 analysts).
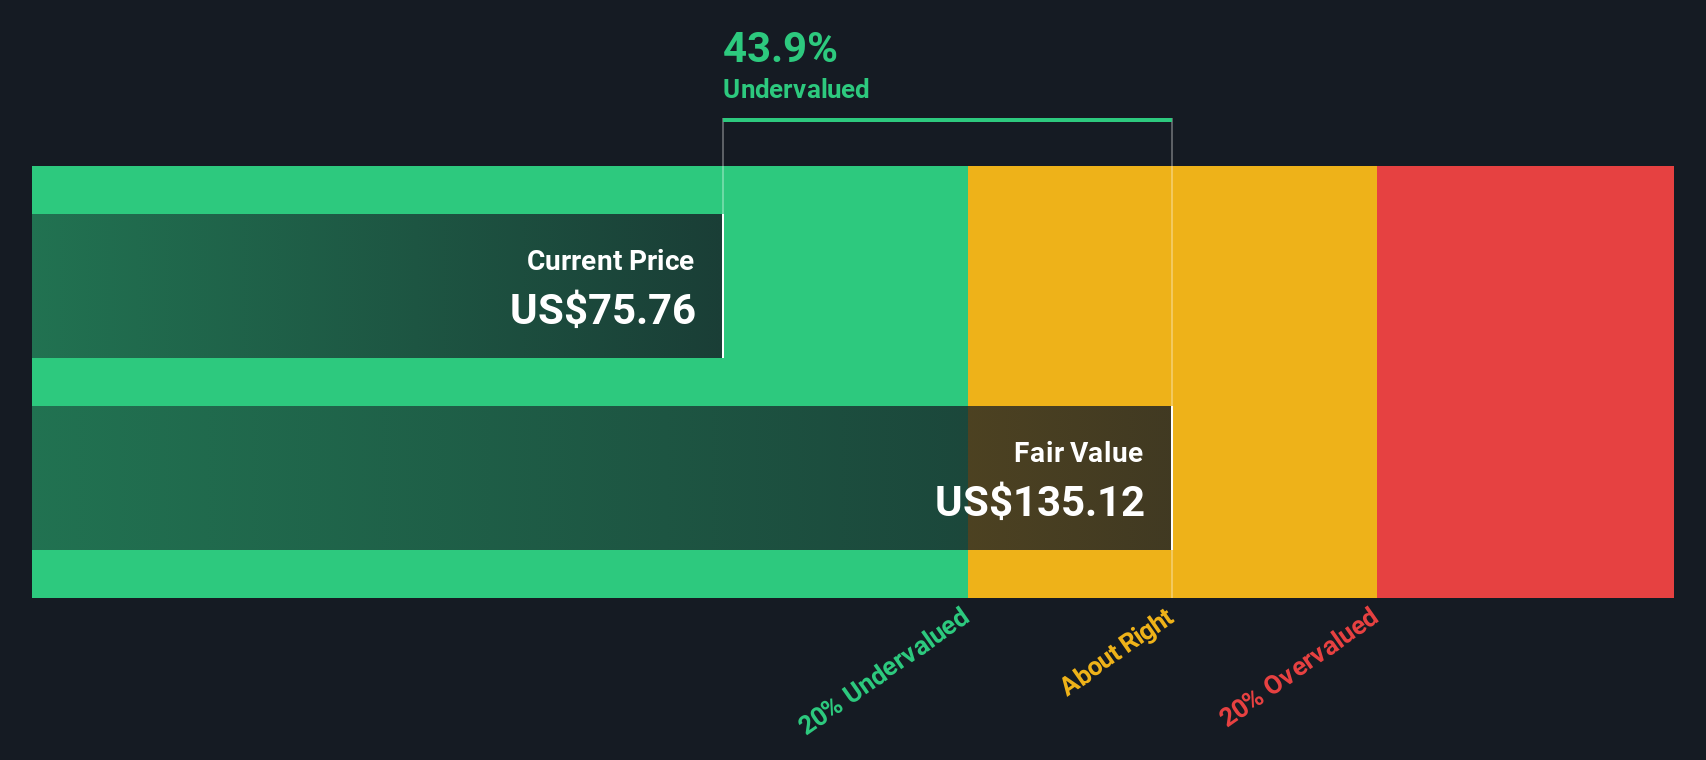
With these positive indicators, the Excess Returns model arrives at an estimated intrinsic value of $146.32 per share. As compared to the current price of $78.05, this represents a potential undervaluation of 46.7 percent.
Result: UNDERVALUED
Our Excess Returns analysis suggests Synchrony Financial is undervalued by 46.7%. Track this in your watchlist or portfolio, or discover 927 more undervalued stocks based on cash flows.
Approach 2: Synchrony Financial Price vs Earnings
The Price-to-Earnings (PE) ratio is widely regarded as an effective valuation tool for profitable companies like Synchrony Financial because it directly compares a company’s current share price to its earnings per share. This provides investors with a clear sense of how much they are paying for each dollar of profit. The PE ratio tends to reflect not just the company’s current performance but also market expectations for future growth and perceived business risks. Generally, growth stocks or those with lower risk profiles command a higher “fair” PE, while companies facing challenges or higher uncertainty trade at lower multiples.
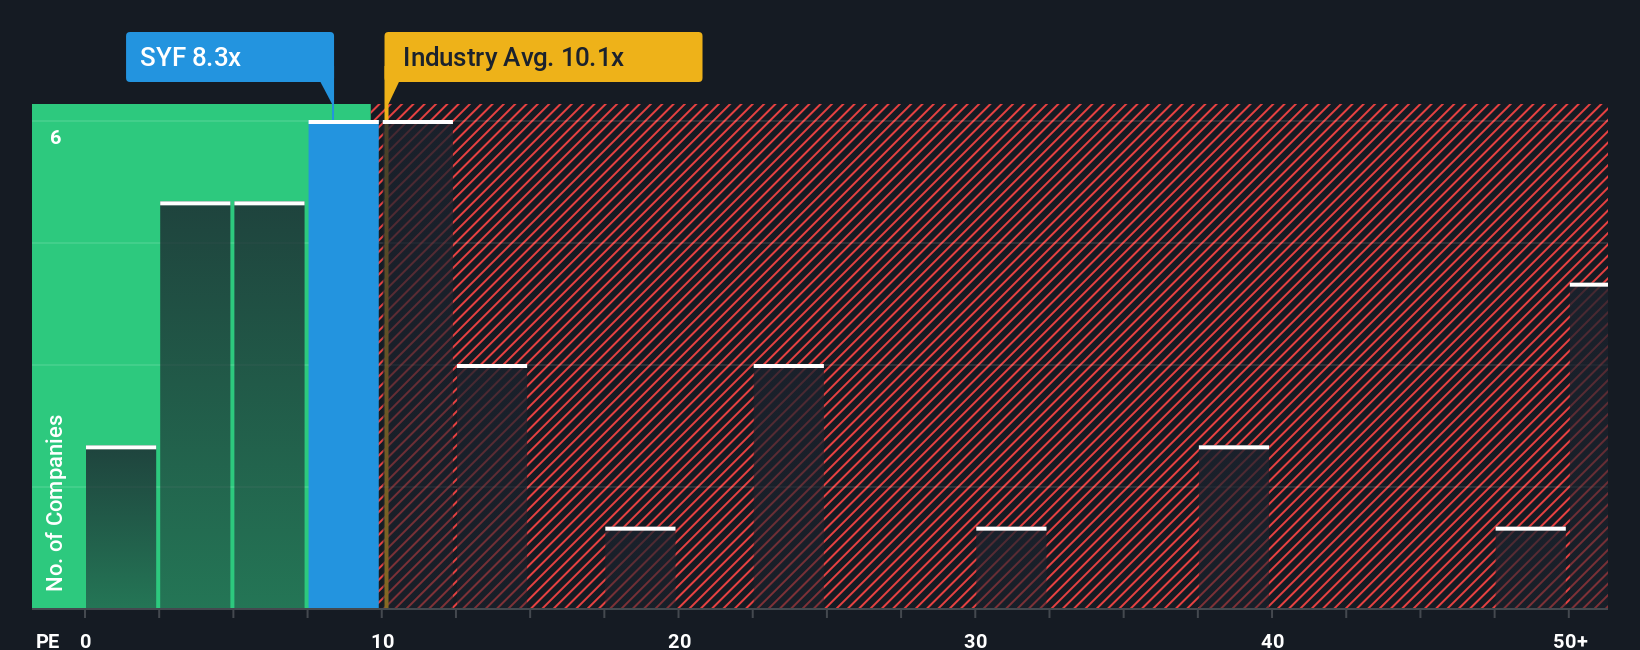
Currently, Synchrony Financial is trading at a PE ratio of 8.1x, which is below the Consumer Finance industry average of 10.0x and well beneath the peer group average of 54.9x. Simply Wall St's proprietary “Fair Ratio” for Synchrony is calculated at 15.0x. The Fair Ratio uses a more nuanced approach: it adjusts for the company’s specific earnings growth outlook, profit margins, market cap, risks, and other industry factors. This makes it a significant improvement over the simple comparison with industry or peer averages, which may not reflect Synchrony's unique strengths or challenges.
With a current PE of 8.1x and a Fair Ratio of 15.0x, Synchrony Financial appears to be trading materially below what would be considered fair value by these standards, suggesting meaningful upside potential for investors.
Result: UNDERVALUED
PE ratios tell one story, but what if the real opportunity lies elsewhere? Discover 1442 companies where insiders are betting big on explosive growth.
Upgrade Your Decision Making: Choose your Synchrony Financial Narrative
Earlier, we mentioned there is an even better way to understand valuation, so let's introduce you to Narratives. A Narrative lets you combine your perspective about a company with your story, alongside the numbers, by setting your own assumptions for fair value, future revenue, earnings, and margins.
With Narratives, you connect your outlook on Synchrony Financial’s future directly to a financial forecast and then arrive at a fair value. This approach makes your investment thesis clear and actionable. This tool is available on Simply Wall St’s Community page, where millions of investors use it to track their ideas.
Narratives make it easy to decide when to buy or sell by visually comparing your estimated Fair Value against the current Price, all in one place. As new news, earnings releases, or data emerge, Narratives update automatically, helping you stay ahead of market moves without hassle.
For example, looking at Synchrony Financial, some investors expect rapid digital and retail partnership growth and assign a fair value of $100 per share. Others, cautious of credit and competitive risks, estimate just $60 per share. This shows how Narratives help express and compare diverse viewpoints in real time.
Do you think there's more to the story for Synchrony Financial? Head over to our Community to see what others are saying!

This article by Simply Wall St is general in nature. We provide commentary based on historical data and analyst forecasts only using an unbiased methodology and our articles are not intended to be financial advice. It does not constitute a recommendation to buy or sell any stock, and does not take account of your objectives, or your financial situation. We aim to bring you long-term focused analysis driven by fundamental data. Note that our analysis may not factor in the latest price-sensitive company announcements or qualitative material. Simply Wall St has no position in any stocks mentioned.
Have feedback on this article? Concerned about the content? Get in touch with us directly. Alternatively, email editorial-team@simplywallst.com