
- PREMIUM
- LIVE QUOTES
 Index Options
 State Street
 CME Group
 Nasdaq
 Cboe
Cboe TradingView
 Wall Street Journal
Is There Now an Opportunity in CarMax After a 2.7% Price Jump This Week?
- Ever wondered if CarMax stock is a hidden value play or a risk best avoided? You are not alone, with many investors taking a fresh look given the stock’s dramatic moves this year.
- Despite a sharp 2.7% bump in the last week, CarMax’s share price is still down over 50% year-to-date. This recent volatility is hard to ignore for both bargain seekers and investors focused on risk management.
- Market chatter has increased around CarMax as sector-wide changes in used car demand and evolving financing conditions have driven its share price swings. Recent headlines about supply chain improvements and increased online competition have further fueled debate over its future prospects.
- Currently, CarMax scores 4 out of 6 on our valuation check. This score highlights some real strengths but also indicates areas for skepticism. Next, we will look deeper into what traditional and alternative valuation approaches reveal. Stay tuned, as we will also explore an even smarter way to spot value before the article concludes.
Find out why CarMax's -54.2% return over the last year is lagging behind its peers.
Approach 1: CarMax Discounted Cash Flow (DCF) Analysis
The Discounted Cash Flow (DCF) model estimates a company's value by projecting its future free cash flows and discounting them back to their worth today. For CarMax, this model uses detailed forecasts and assumptions about cash flow trends to arrive at an intrinsic value for the stock.
CarMax’s most recent twelve-month Free Cash Flow stands at $732.9 million. Analysts project free cash flow to reach $754 million by 2028. Longer-term forecasts, extrapolated by Simply Wall St, predict the company’s free cash flow could be around $641 million in 2035. These projections help create a picture of CarMax’s growth pipeline and future earning potential.
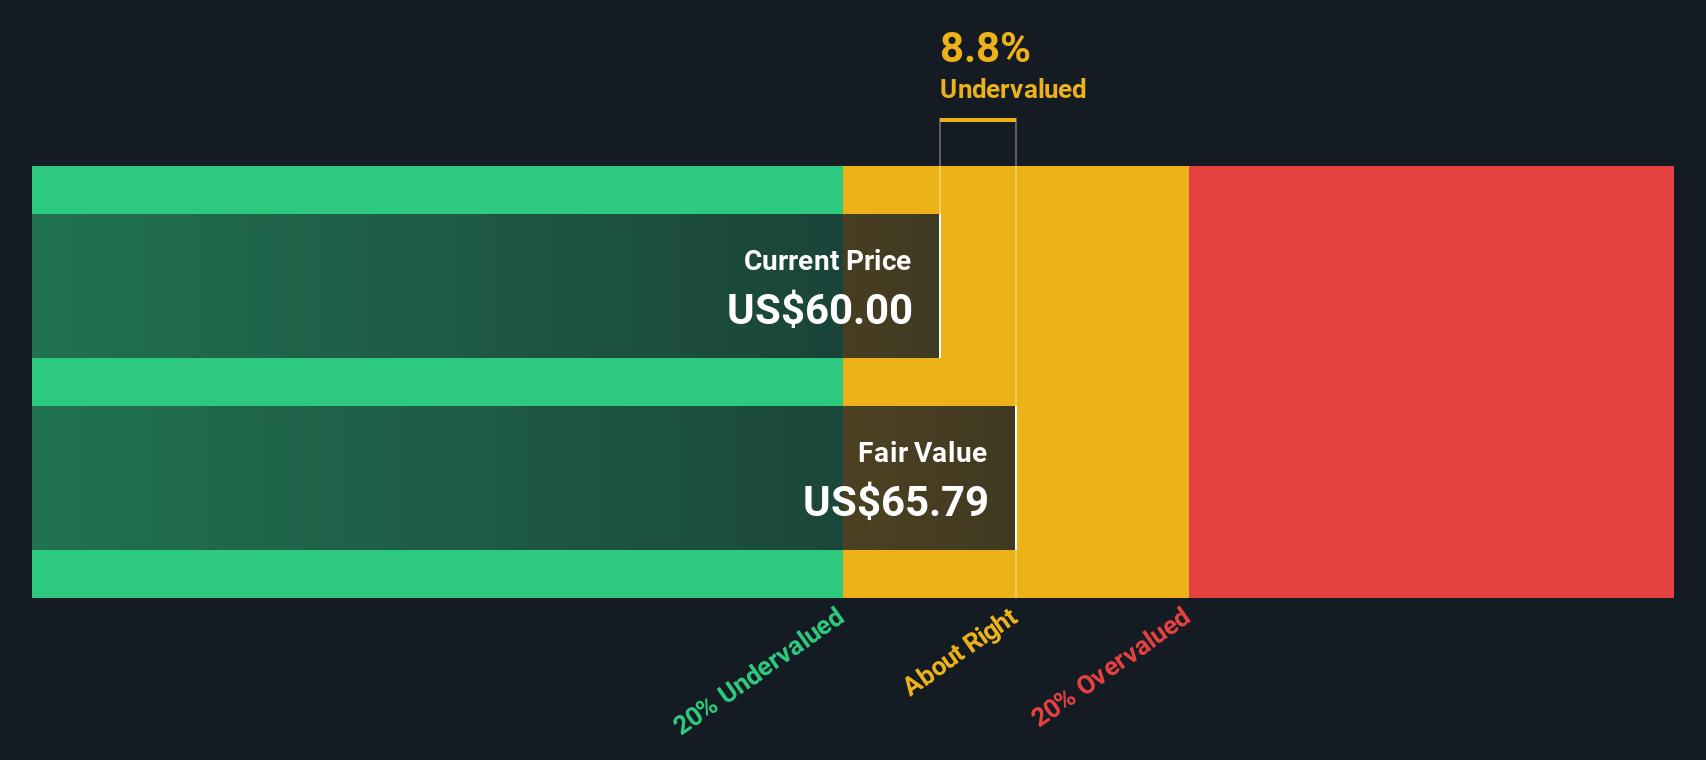
Applying the DCF model, CarMax’s estimated fair value comes to $44.15 per share. Compared to the current market price, this suggests the stock is trading at a 12.7 percent discount to its intrinsic value. The analysis indicates CarMax shares may be undervalued for investors who focus on long-term fundamentals.
Result: UNDERVALUED
Our Discounted Cash Flow (DCF) analysis suggests CarMax is undervalued by 12.7%. Track this in your watchlist or portfolio, or discover 932 more undervalued stocks based on cash flows.
Approach 2: CarMax Price vs Earnings (PE)
The Price-to-Earnings (PE) ratio is one of the most widely used metrics to value profitable companies, as it relates a company’s market price directly to its per-share earnings. Investors favor the PE ratio for firms like CarMax because it provides a snapshot of how much you are paying for current profits, which is a key gauge for established, profit-generating businesses.
Determining what counts as a “normal” or “fair” PE ratio, however, depends on several factors. Higher growth expectations or lower risk profiles tend to justify elevated PE multiples, while declining prospects or higher uncertainty usually result in lower numbers.
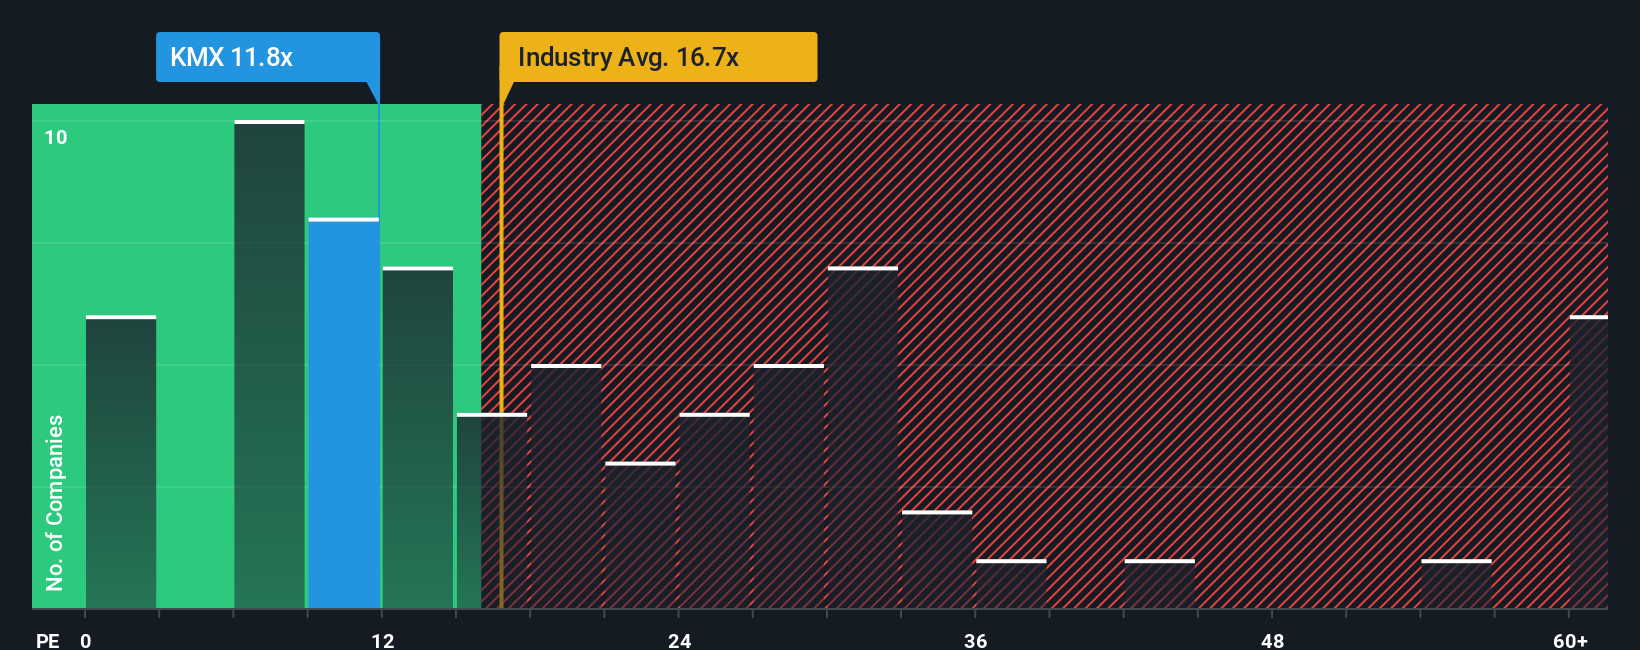
CarMax currently trades at a PE ratio of 10.87x. This is well below the Specialty Retail industry average of 18.09x and the peer group average of 12.08x, suggesting it is priced at a significant discount. However, raw comparisons can be misleading, as they do not account for the nuances of CarMax’s growth outlook, risk profile, or profit margins.
This is where Simply Wall St’s proprietary “Fair Ratio” comes in. The Fair Ratio, which is 17.60x for CarMax, is more insightful than standard benchmarks because it blends company-specific factors such as earnings growth forecasts, industry conditions, profit margins, total market cap, and risk elements. By tailoring the PE benchmark in this way, investors get a richer sense of what is justified for CarMax rather than relying on generic averages.
Comparing the current PE ratio of 10.87x to the Fair Ratio of 17.60x, CarMax trades well below what would be expected based on its fundamentals. This supports the view that the stock appears undervalued on this metric.
Result: UNDERVALUED
PE ratios tell one story, but what if the real opportunity lies elsewhere? Discover 1445 companies where insiders are betting big on explosive growth.
Upgrade Your Decision Making: Choose your CarMax Narrative
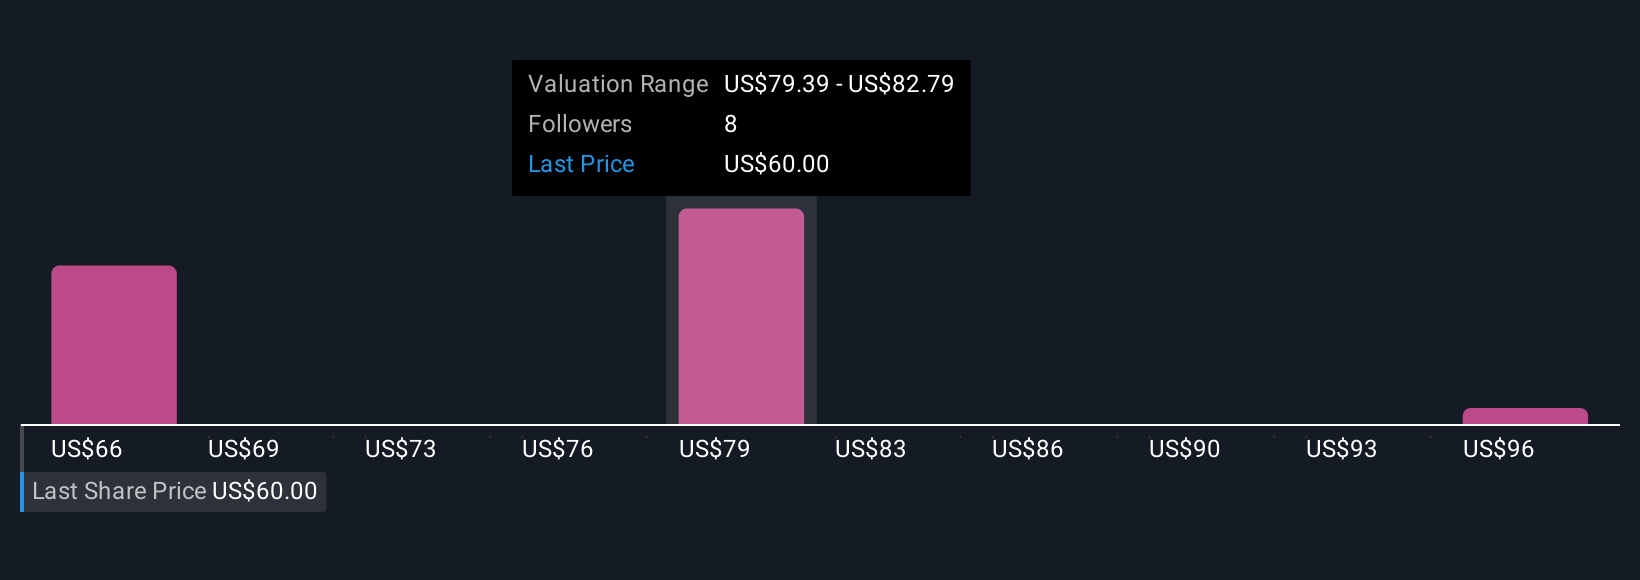
Earlier we mentioned that there's an even better way to understand valuation, so let's introduce you to Narratives. A Narrative is your personal story or viewpoint about a company, linking the company’s business outlook to numbers like future revenue, earnings, and profit margins, and ultimately, to your estimate of its fair value.
Rather than just relying on fixed ratios or averages, Narratives let you ground your investment decisions in your own logic and forecasts, all within an easy tool available on Simply Wall St’s Community page. You can compare your Narrative’s Fair Value to the current share price and quickly decide if CarMax looks like a buy, sell, or hold based on real-time numbers and your convictions.
The best part is Narratives update dynamically each time key information changes, like when new financial results or news stories break. For CarMax, one investor’s Narrative might be bullish, based on expectations that earnings will rebound to $1.1 billion in a few years, while another might see continued headwinds leading to just $532 million in future profits. These differences drive very different fair value targets.
With Narratives, you have a transparent, dynamic way to capture your thinking, sense-check analyst estimates, and make smarter, more confident investment calls.
Do you think there's more to the story for CarMax? Head over to our Community to see what others are saying!
This article by Simply Wall St is general in nature. We provide commentary based on historical data and analyst forecasts only using an unbiased methodology and our articles are not intended to be financial advice. It does not constitute a recommendation to buy or sell any stock, and does not take account of your objectives, or your financial situation. We aim to bring you long-term focused analysis driven by fundamental data. Note that our analysis may not factor in the latest price-sensitive company announcements or qualitative material. Simply Wall St has no position in any stocks mentioned.
Have feedback on this article? Concerned about the content? Get in touch with us directly. Alternatively, email editorial-team@simplywallst.com