
Does HP’s Recent Price Rebound Signal Real Value in 2025?
- Wondering if HP could represent real value for your portfolio? You are not alone. We are here to dig beneath the surface to find out what the numbers really say.
- HP's stock has seen some interesting twists lately, rising 1.9% in the past week but still down 24.8% year-to-date. This could signal both renewed interest and lingering concerns from investors.
- Recently, HP has been featured in headlines as analysts debate the company's long-term health and shifting strategy amid evolving tech market dynamics. Technology sector volatility and fresh discussions about HP's market positioning have added a complex layer to recent price moves.
- When we put HP through our valuation checks, it scores a solid 5 out of 6 for being undervalued. Let us break down the valuation methods and later reveal why there may be an even smarter way to uncover HP's true value story.
Find out why HP's -28.3% return over the last year is lagging behind its peers.
Approach 1: HP Discounted Cash Flow (DCF) Analysis
A Discounted Cash Flow (DCF) model estimates a company's intrinsic value by projecting its future cash flows and discounting them back to their present worth. This approach aims to capture both the near-term and long-term earning power of the business in today's dollars.
For HP, the latest reported Free Cash Flow (FCF) stands at approximately $2.99 billion. Analyst consensus provides annual FCF estimates for the next five years. After this period, projections are extrapolated out to a decade by Simply Wall St. By 2030, HP's FCF is estimated to reach about $3.08 billion. These projections help quantify the potential value HP could return to shareholders over time.
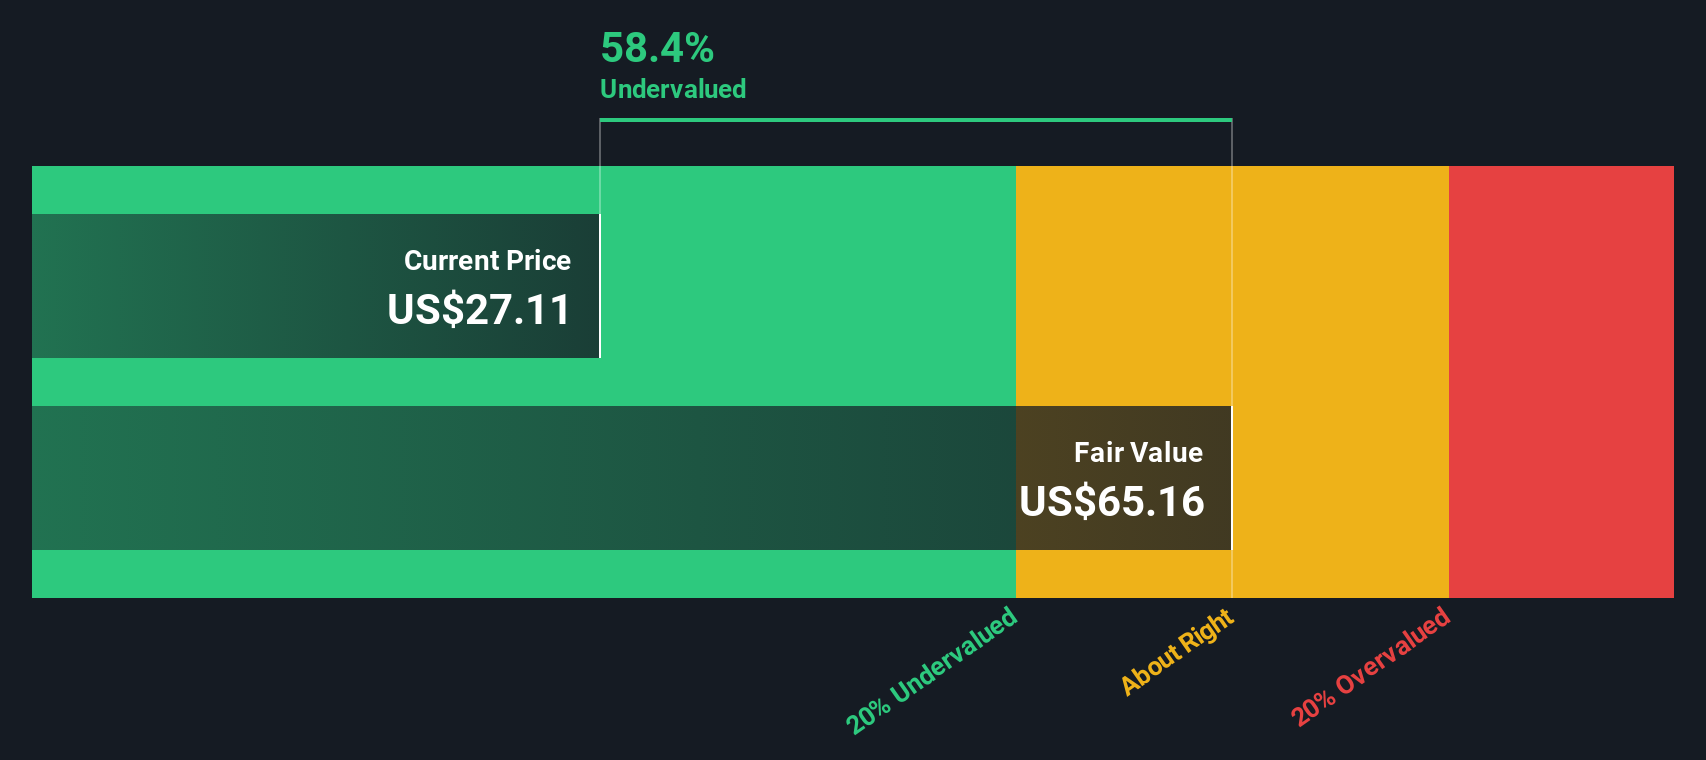
By applying the DCF model's two-stage free cash flow to equity method, the analysis yields an intrinsic value of $45.38 per share. Compared to HP's current trading level, this suggests a discount of 46.2%. In other words, the DCF model implies that HP's stock is significantly undervalued on a cash flow basis.
Result: UNDERVALUED
Our Discounted Cash Flow (DCF) analysis suggests HP is undervalued by 46.2%. Track this in your watchlist or portfolio, or discover 921 more undervalued stocks based on cash flows.
Approach 2: HP Price vs Earnings (PE)
The Price-to-Earnings (PE) ratio is commonly used to value profitable companies like HP, as it ties a company’s stock price directly to its earnings. This makes it a widely accepted measure for comparing businesses with steady profits, helping investors see what they are paying for each dollar of earnings.
Growth prospects and perceived risks play a major role in what is considered a "normal" or "fair" PE ratio. Companies with higher expected growth or lower risk generally trade at higher PE multiples, while those with slower growth or more uncertainty tend to have lower PE ratios.
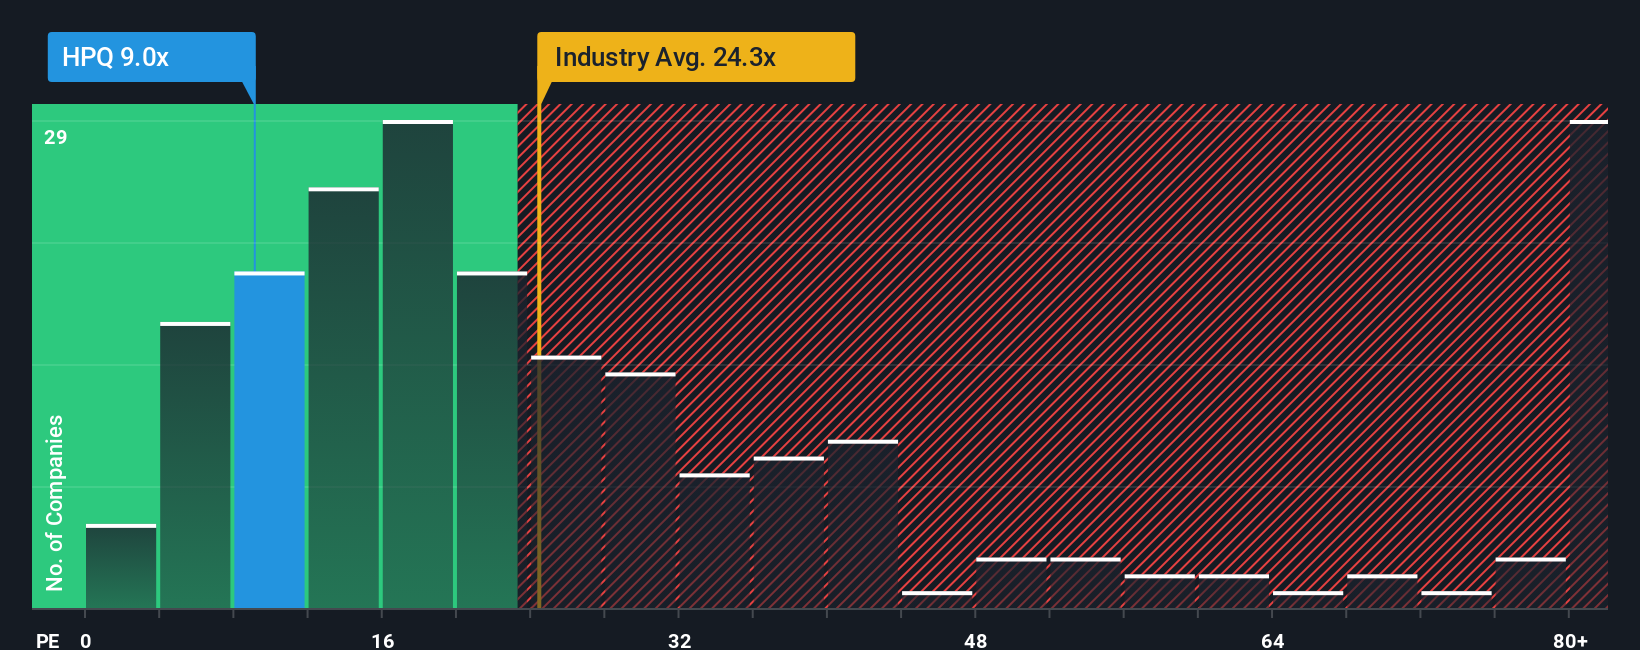
Currently, HP trades at a PE ratio of 9x. This figure is well below the tech industry average of 22x and the average of its listed peers at 67x. On paper, HP’s valuation appears deeply discounted compared to both its sector and direct rivals.
Simply Wall St takes this a step further with the "Fair Ratio," a proprietary figure that goes beyond peer or industry comparisons. The Fair Ratio considers HP’s earnings growth, profit margins, risks, business size, and industry dynamics to estimate where its PE should reasonably be. For HP, the Fair Ratio is 26x, which is markedly higher than its current level.
This means that while broad comparisons already suggest HP could be undervalued, the Fair Ratio, which factors in HP’s company-specific strengths and risks, offers an even stronger indication. HP is trading substantially below the valuation it could command given its fundamentals.
Result: UNDERVALUED
PE ratios tell one story, but what if the real opportunity lies elsewhere? Discover 1438 companies where insiders are betting big on explosive growth.
Upgrade Your Decision Making: Choose your HP Narrative
Earlier we mentioned that there is an even better way to understand valuation. Let us introduce you to Narratives. A Narrative is your own explanation of what you believe about HP, tying together your story of the company's future, your assumptions for its revenue, earnings, profit margins, and the fair value you think it deserves.
Unlike static models, Narratives directly connect the company’s story—how you see trends, risks, or catalysts—to a dynamic financial forecast and then translate that into a living fair value. Narratives are easy to use and accessible right on Simply Wall St’s Community page, where millions of investors share and update their perspectives.
With Narratives, you can clearly see how your Fair Value compares to the current Price. This can help you make more informed decisions about whether to buy or sell. The tool also updates automatically as new information such as news or earnings becomes available, helping keep your view of HP current and informed.
For example, some HP investors see supply chain challenges and weaker print demand, arriving at a fair value near $25. Others focus on AI-driven PC growth and cost savings to support higher targets close to $30. Narratives allow you to transparently compare these outlooks, choose the one that best fits your view, or create your own to guide your investing decisions.
Do you think there's more to the story for HP? Head over to our Community to see what others are saying!

This article by Simply Wall St is general in nature. We provide commentary based on historical data and analyst forecasts only using an unbiased methodology and our articles are not intended to be financial advice. It does not constitute a recommendation to buy or sell any stock, and does not take account of your objectives, or your financial situation. We aim to bring you long-term focused analysis driven by fundamental data. Note that our analysis may not factor in the latest price-sensitive company announcements or qualitative material. Simply Wall St has no position in any stocks mentioned.
Have feedback on this article? Concerned about the content? Get in touch with us directly. Alternatively, email editorial-team@simplywallst.com