
Is the Rally in Amex Shares Justified After Strong Digital Expansion News?
- Curious if American Express stock is priced right for your next move? You are not alone, as plenty of investors wonder if the current price reflects the company's true value.
- In the past year, American Express shares have surged 21.2% and are up 22.4% year-to-date, signaling sustained market optimism and hinting at growth that is hard to ignore.
- Recent headlines highlight American Express's push into digital partnerships and exclusive experiences. These moves have attracted both new customers and renewed analyst attention, helping to drive the company’s evolving narrative in a competitive financial sector.
- On our valuation checks, American Express earns a score of 1 out of 6, suggesting the market might be factoring in high expectations. We will break down the traditional valuation approaches shortly, but keep reading for a smart alternative that could give you an even clearer view of the stock's real opportunity.
American Express scores just 1/6 on our valuation checks. See what other red flags we found in the full valuation breakdown.
Approach 1: American Express Excess Returns Analysis
The Excess Returns valuation method focuses on assessing how effectively a company generates returns on its invested equity beyond what investors expect, after accounting for the cost of equity. This model highlights whether American Express is producing value above the market’s required rate of return.
For American Express, several key metrics stand out. The book value per share is $47.05 while the stable earnings per share (EPS) is forecast at $18.40, based on weighted future Return on Equity estimates from 13 analysts. The stable book value is projected to be $50.82 per share, based on estimates from 9 analysts. The company’s cost of equity sits at $4.27 per share, and its excess return, meaning value created over and above the required return, is $14.13 per share. Notably, American Express’s average Return on Equity is an impressive 36.20%, further supporting the company’s ability to outperform the standard cost of equity over time.
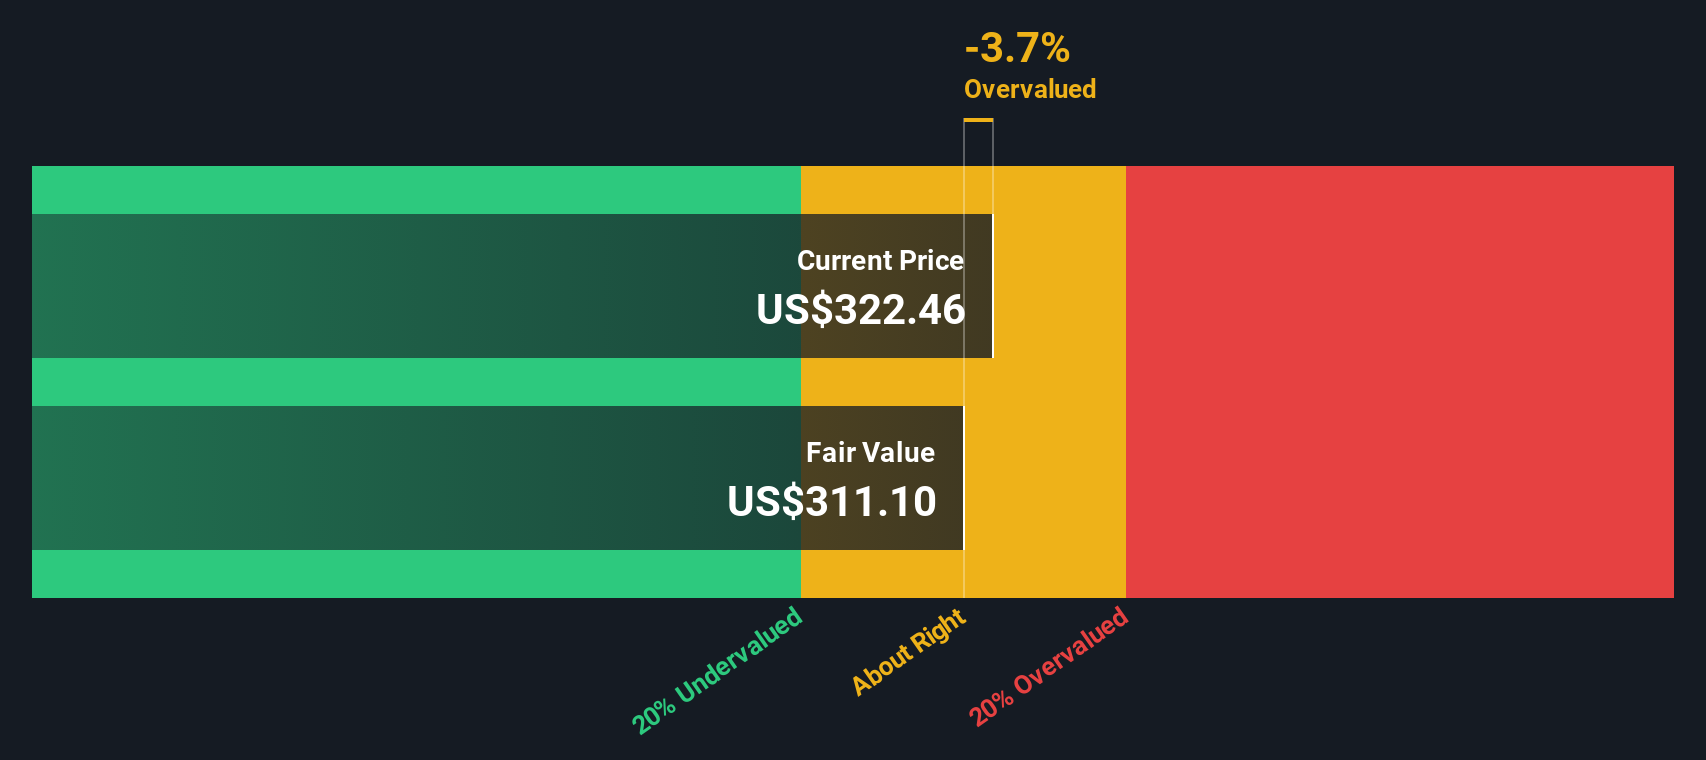
By these calculations, the intrinsic value per share according to the Excess Returns model is $326.06. However, the stock currently trades at a 12.0% premium to this estimate, suggesting it is overvalued based on this fundamental framework.
Result: OVERVALUED
Our Excess Returns analysis suggests American Express may be overvalued by 12.0%. Discover 920 undervalued stocks or create your own screener to find better value opportunities.
Approach 2: American Express Price vs Earnings
The Price-to-Earnings (PE) ratio is the preferred valuation metric for American Express because it helps gauge how much investors are willing to pay today for each dollar of company earnings. This makes it especially relevant for steady, profitable companies like American Express, where consistent earnings growth is a central part of the story.
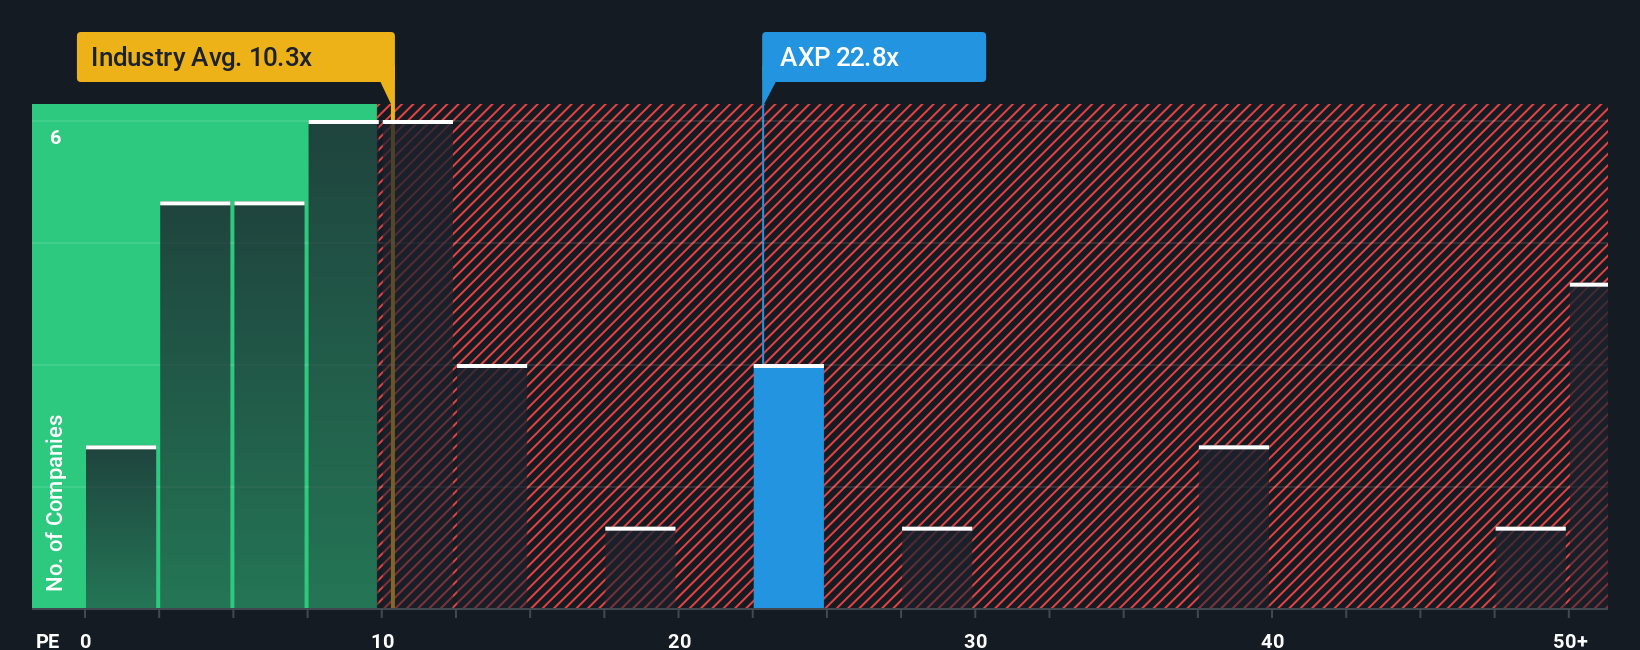
When evaluating PE ratios, higher expectations for future earnings growth or lower perceived risk typically justify a higher “normal” or fair PE multiple. Conversely, slower growth or higher risks would drive the fair PE lower. American Express currently trades at a PE of 24x, just below the peer average of 25.4x and well above the Consumer Finance industry average of 9.8x. This indicates investors see more value or stability in American Express compared to its competitors.
To go a step further, Simply Wall St’s “Fair Ratio” takes into account American Express’s own earnings growth prospects, profit margins, industry trends, company size, and risk profile. This provides a more nuanced benchmark. For American Express, the calculated Fair Ratio is 19.9x. This is lower than the current PE, suggesting the stock is trading at a premium when all these factors are considered together, rather than through basic industry or peer comparisons.
Result: OVERVALUED
PE ratios tell one story, but what if the real opportunity lies elsewhere? Discover 1443 companies where insiders are betting big on explosive growth.
Upgrade Your Decision Making: Choose your American Express Narrative
Earlier we mentioned there is an even better way to understand valuation, so let’s introduce you to Narratives. Narratives are a dynamic tool that allow you to frame your investment view as a story. This approach combines your perspective about a company with your assumptions about its future revenue, earnings, and profitability to arrive at your own Fair Value estimate.
This approach makes investing more approachable by connecting the company’s story, such as its competitive strengths or risks, to real financial forecasts and valuations. Narratives are easily accessible on Simply Wall St's Community page, used by millions of investors, allowing you to compare your view with others and track how perspectives shift over time as fresh news or financial results are released.
Narratives help you decide when to buy or sell by directly comparing your Fair Value to the current market price. Because they update when new data comes in, you can quickly adapt your strategy as the story evolves. For American Express, some investors might see its story supporting a Fair Value as high as $366.63 due to international growth and premium demand. Others may take a more cautious view with a Fair Value of $230.00, reflecting concerns about competition and a saturated U.S. market.
For American Express, here are previews of two leading American Express Narratives:
- 🐂 American Express Bull Case
Fair Value: $366.63
Current Price is 0.4% below this Fair Value
Expected Revenue Growth: 11.1%
- Growth is powered by younger customers, international expansion, and premium product enhancements in line with changing consumer trends worldwide.
- Strategic investments in technology and integrated B2B solutions support customer retention, operational efficiency, and SME revenue. These initiatives help drive top-tier profitability.
- Key risks include digital disruption from alternative payment methods, rising competition, higher costs, and regulatory challenges that could affect traditional revenue sources and margins.
- 🐻 American Express Bear Case
Fair Value: $350.87
Current Price is 4.1% above this Fair Value
Expected Revenue Growth: 10.1%
- Focus on premium cardmembers, product innovation, and younger demographics supports retention, international growth, and future earnings stability.
- Strong credit quality and disciplined capital strategies help maintain resilient margins and consistent investment in products and partnerships.
- Increasing competition, shifts toward digital payment alternatives, and the company's significant reliance on the US market present risks to long-term growth and profitability.
Do you think there's more to the story for American Express? Head over to our Community to see what others are saying!
This article by Simply Wall St is general in nature. We provide commentary based on historical data and analyst forecasts only using an unbiased methodology and our articles are not intended to be financial advice. It does not constitute a recommendation to buy or sell any stock, and does not take account of your objectives, or your financial situation. We aim to bring you long-term focused analysis driven by fundamental data. Note that our analysis may not factor in the latest price-sensitive company announcements or qualitative material. Simply Wall St has no position in any stocks mentioned.
Have feedback on this article? Concerned about the content? Get in touch with us directly. Alternatively, email editorial-team@simplywallst.com