
Does the 40% Drop in 2025 Make Stride a Hidden Opportunity?
- Wondering if Stride is a bargain right now? You are not alone, especially if you are keen to uncover undervalued opportunities before the rest of the market catches up.
- Stride's share price has dipped 2.7% in the past week and is down 40% year-to-date. The stock has delivered a 185.7% return over five years, highlighting both volatility and long-term growth potential.
- Several recent news stories have focused on shifting sentiment in the online education sector and regulatory updates, both of which have influenced Stride’s price movements. Industry discussions around evolving edtech standards and digital classroom innovations have contributed to ongoing debates about the company’s future prospects.
- Stride currently scores 5 out of 6 on our valuation checklist, standing out as undervalued in most respects. Let us dive into the major valuation methods used to assess Stride, and later we will highlight a more nuanced approach to understanding the company’s true worth.
Find out why Stride's -40.3% return over the last year is lagging behind its peers.
Approach 1: Stride Discounted Cash Flow (DCF) Analysis
The Discounted Cash Flow (DCF) model estimates a company's value by projecting its future cash flows and then discounting them back to today's dollars. This approach helps investors assess what the business is truly worth, based on expected free cash generated over time rather than short-term market sentiment.
For Stride, the current Free Cash Flow (FCF) stands at $305.3 Million. Analyst forecasts indicate steady growth, with FCF expected to reach $404.5 Million by 2027. Looking further ahead, ten-year projections suggest continued expansion, culminating in approximately $529 Million by 2035, as estimated by Simply Wall St's extrapolation models. All cash flow figures are calculated in US Dollars.
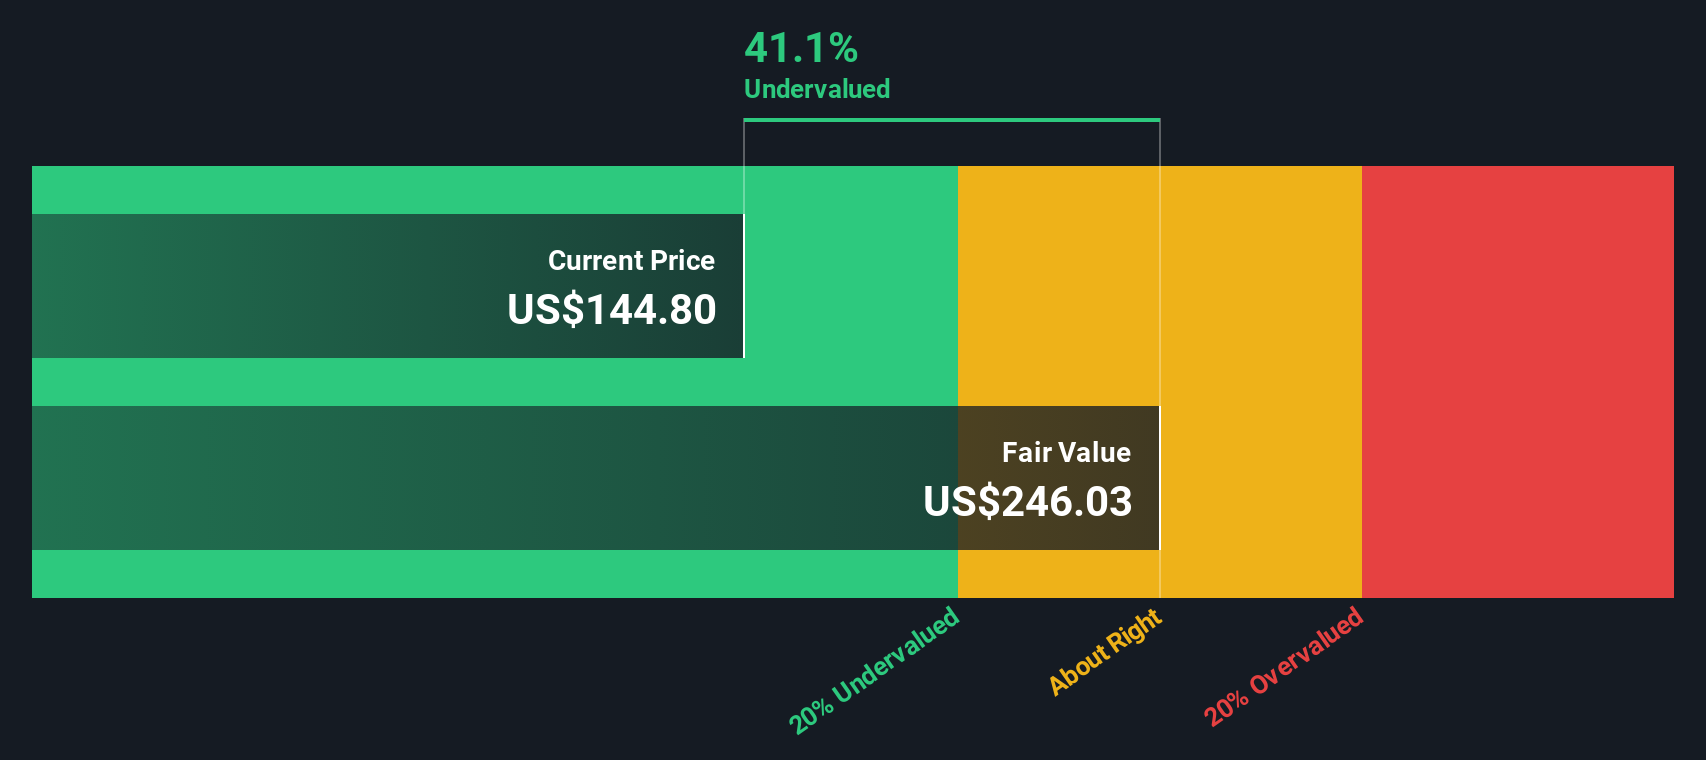
The result of this two-stage Free Cash Flow to Equity DCF model assigns Stride an estimated intrinsic value of $217.41 per share. Compared with the company’s current share price, this level suggests that Stride is trading at a 70.7% discount to its fair value. This outcome makes the stock appear notably undervalued according to this method.
Result: UNDERVALUED
Our Discounted Cash Flow (DCF) analysis suggests Stride is undervalued by 70.7%. Track this in your watchlist or portfolio, or discover 923 more undervalued stocks based on cash flows.
Approach 2: Stride Price vs Earnings
The Price-to-Earnings (PE) ratio is widely considered the go-to metric for valuing profitable companies like Stride. It reveals how much investors are willing to pay for each dollar of current earnings and helps indicate whether a stock is attractively priced relative to its profit generation ability.
What counts as a “normal” PE ratio depends on both growth expectations and perceived risk. Companies with stronger growth prospects or more stable earnings typically justify higher multiples. In contrast, higher-risk or slower-growth businesses usually trade at a discount.
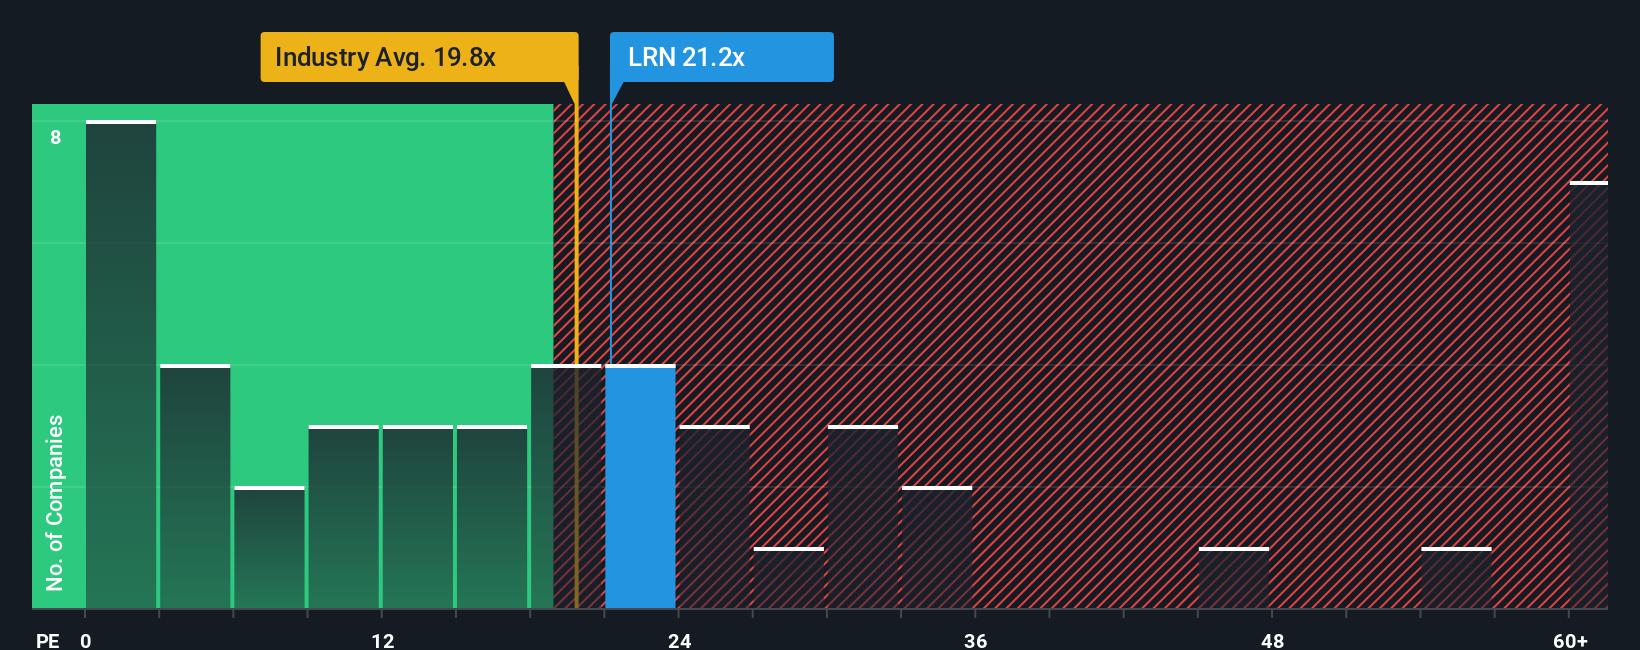
Stride currently trades at a PE ratio of 8.7x. By comparison, the average PE ratio for its Consumer Services industry peers is 15.9x and the peer group’s average is 15.7x. This places Stride well below both benchmarks and suggests investors may be factoring in lower growth or higher risk relative to the sector.
Simply Wall St's proprietary Fair Ratio model goes a step beyond standard industry or peer comparisons. It customizes the "fair" multiple Stride should trade at by accounting for a range of factors, including future earnings growth, profit margins, risk profile, market cap, and the specific dynamics of its industry. This tailored approach provides a more nuanced and accurate sense of value.
Stride's Fair Ratio is calculated at 19.2x. Since this is significantly higher than Stride's current PE of 8.7x, the shares are trading well below the estimated fair value based on earnings power and risk-adjusted outlook.
Result: UNDERVALUED
PE ratios tell one story, but what if the real opportunity lies elsewhere? Discover 1439 companies where insiders are betting big on explosive growth.
Upgrade Your Decision Making: Choose your Stride Narrative
Earlier we mentioned that there is an even better way to understand valuation, so let us introduce you to Narratives. A Narrative is essentially your own story about a company like Stride, connecting your perspective on its future to a tailored financial forecast and then to an estimated fair value.
Narratives go beyond the numbers. They blend what you believe about Stride's business, such as potential future enrollment rebounds or challenges in career tech, with forecasts around revenue growth, profit margins, and risk. This approach helps you see not just how the market values Stride right now, but also what it could be worth if your assumptions play out.
On Simply Wall St’s Community page, millions of investors easily create and share Narratives, tracking their reasoning alongside the latest data. When new information, such as updated earnings or unexpected lawsuits, is released, Narratives update automatically so your investment case stays relevant and up-to-date.
By comparing the Fair Value from your Narrative to the current market price, you gain a clear signal for when it makes sense to buy, hold, or sell. For example, some investors might believe Stride’s fair value is as high as $163.75 if future enrollment rebounds as expected, while others see it as low as $115.50 given operational and regulatory risks. This demonstrates how Narratives reflect diverse, dynamic views.
Do you think there's more to the story for Stride? Head over to our Community to see what others are saying!

This article by Simply Wall St is general in nature. We provide commentary based on historical data and analyst forecasts only using an unbiased methodology and our articles are not intended to be financial advice. It does not constitute a recommendation to buy or sell any stock, and does not take account of your objectives, or your financial situation. We aim to bring you long-term focused analysis driven by fundamental data. Note that our analysis may not factor in the latest price-sensitive company announcements or qualitative material. Simply Wall St has no position in any stocks mentioned.
Have feedback on this article? Concerned about the content? Get in touch with us directly. Alternatively, email editorial-team@simplywallst.com