
Is Realty Income a Hidden Value Play After Recent Retail Expansion News?
- Ever wondered if Realty Income could be an undervalued gem hidden in plain sight? Let’s break down whether today’s price holds up against its true worth.
- The stock held steady this week with a 0.8% gain. Zooming out, returns are up 8.6% year-to-date, which may indicate shifting investor sentiment and potential for growth.
- Recent news about Realty Income’s continued expansion in retail real estate, including new acquisitions across key regions, has put the spotlight back on the company’s income-driven strategy. Investors are watching to see how these moves shape stability and potential returns in a changing interest rate environment.
- Right now, Realty Income scores a 2 out of 6 on our valuation checklist. This means it may look undervalued by some methods but not all. We’ll break down how analysts reach these numbers next, and at the end, I’ll share a smarter way to cut through the noise and find true value.
Realty Income scores just 2/6 on our valuation checks. See what other red flags we found in the full valuation breakdown.
Approach 1: Realty Income Discounted Cash Flow (DCF) Analysis
A Discounted Cash Flow (DCF) model estimates a company’s intrinsic value by projecting its future cash generation, specifically its adjusted funds from operations, and then discounting those cash flows back to today’s value. This approach gives investors a sense of what the company is truly worth based on its ability to generate cash in the coming years.
For Realty Income, the current Free Cash Flow is $3.62 billion. Analysts provide detailed forecasts up to five years ahead, and for Realty Income, projections indicate steady cash flow growth, with Free Cash Flow expected to reach $4.70 billion by 2029. Beyond this period, Simply Wall St extrapolates the trajectory using historical growth and industry expectations.
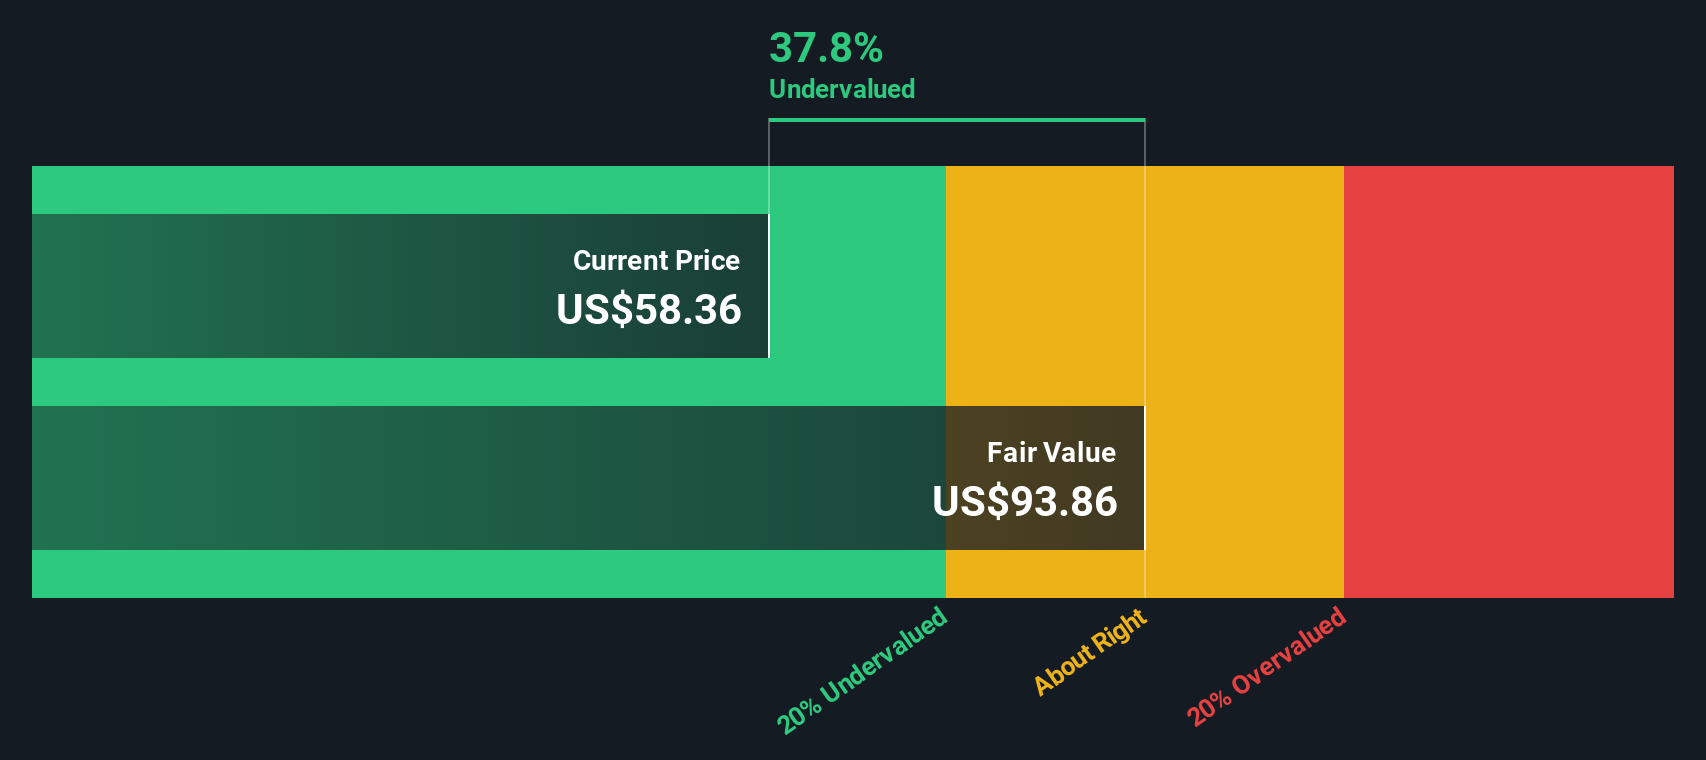
Applying this two-stage DCF model, Realty Income’s estimated intrinsic value is $96.96 per share. Based on the latest share price, this suggests the stock is approximately 41.1% undervalued.
With cash flows projected to grow and substantial value not yet recognized by the broader market, the DCF model indicates a clear mismatch between price and potential.
Result: UNDERVALUED
Our Discounted Cash Flow (DCF) analysis suggests Realty Income is undervalued by 41.1%. Track this in your watchlist or portfolio, or discover 927 more undervalued stocks based on cash flows.
Approach 2: Realty Income Price vs Earnings
For profitable companies like Realty Income, the Price-to-Earnings (PE) ratio is a well-established way to value a stock. It reflects what the market is willing to pay today for a dollar of earnings, making it a useful tool when scanning for opportunities among established, income-generating businesses.
What qualifies as a “fair” PE ratio depends on how quickly a company is expected to grow and how risky investors perceive it to be. Higher growth or lower risk typically leads to a higher PE, while slower growth or higher risk generally results in a lower one.
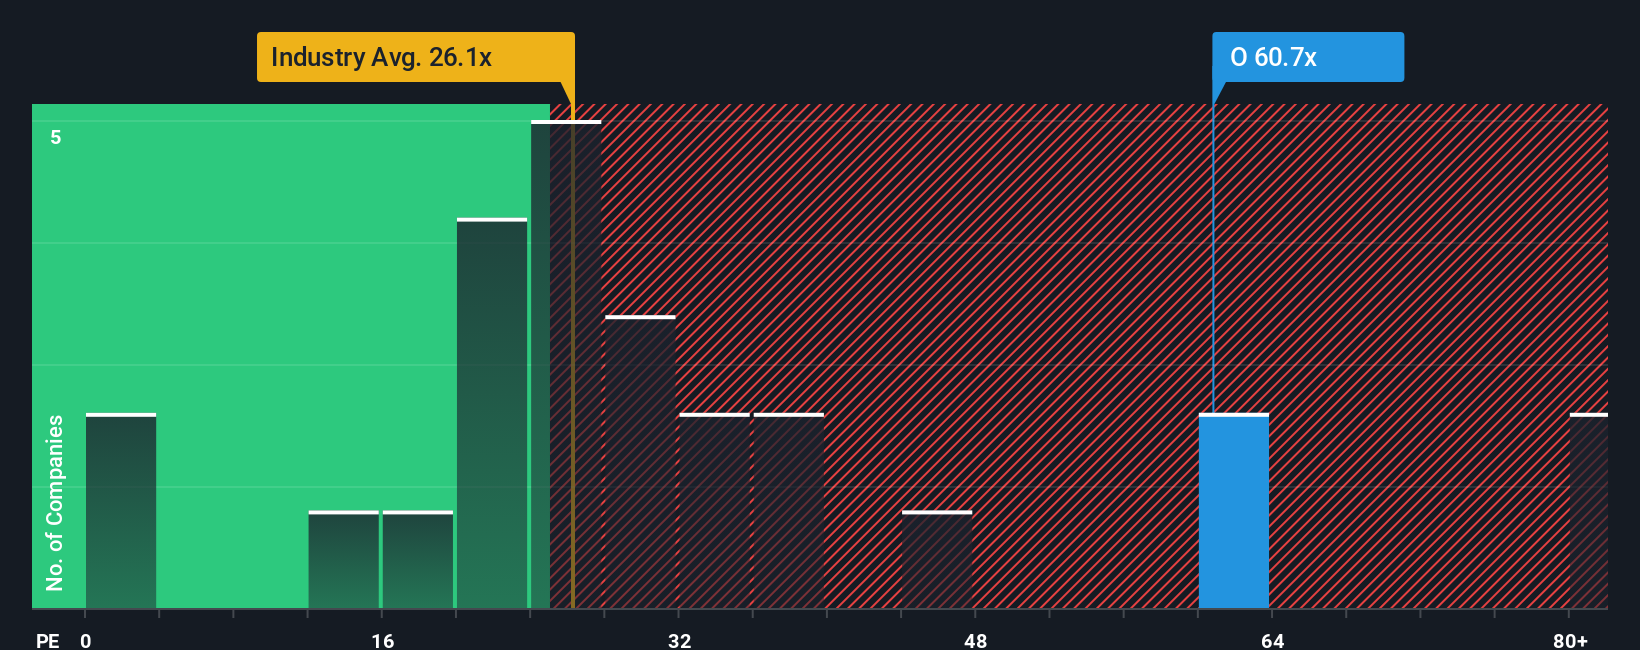
Realty Income currently trades at a PE ratio of 54.6x. For context, the average PE across its Retail REITs industry is 27.1x, and its close peers average 32.7x. These figures suggest Realty Income is priced higher than both the industry average and its immediate competitors.
This is where Simply Wall St’s proprietary Fair Ratio provides additional insight. Rather than only comparing to peers or the industry at large, the Fair Ratio (currently 37.5x) takes into account Realty Income’s specific combination of earnings growth, profit margins, market capitalization, and underlying risks. This method offers a more comprehensive perspective, helping investors avoid errors that can occur when relying solely on broad industry comparisons.
In Realty Income’s case, the current PE of 54.6x is significantly higher than its Fair Ratio of 37.5x. This indicates the stock is trading above what would be considered fair based on its financial fundamentals and market conditions.
Result: OVERVALUED
PE ratios tell one story, but what if the real opportunity lies elsewhere? Discover 1439 companies where insiders are betting big on explosive growth.
Upgrade Your Decision Making: Choose your Realty Income Narrative
Earlier we mentioned that there's an even better way to understand valuation, so let's introduce you to Narratives. A Narrative is simply a story you tell about a company, based on data, experience, and what you believe is most likely to happen next. Narratives connect your outlook for Realty Income’s future revenue, earnings, and margins with a financial forecast, and from there to your personal estimate of fair value.
On Simply Wall St, Narratives are an intuitive tool available on the Community page, empowering millions of investors to build and share their own investment stories backed by numbers, not just headlines. Narratives help you cut through the noise by outlining your assumptions and seeing how changes in news, earnings, or forecasts automatically update your estimated fair value. This can help you quickly decide if the stock’s current price is attractive or not.
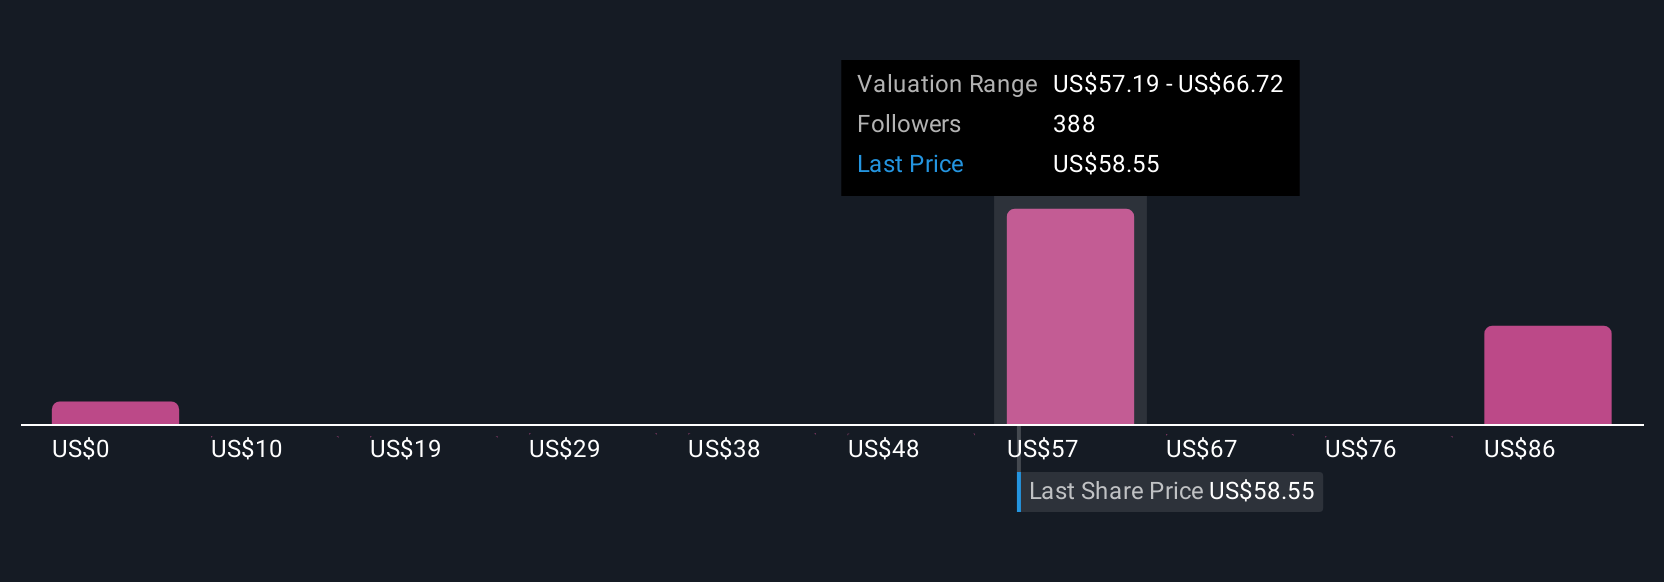
For example, one investor might create a Narrative for Realty Income with a bullish forecast, targeting a fair value as high as $75.00 and seeing resilient revenue and dividend growth ahead. Another could be more conservative, estimating fair value closer to $57.97 if they expect slower dividend increases and tighter margins. Narratives help you clearly see the gap between Price and Fair Value, making your buy, sell, or hold decisions more informed and transparent.
Do you think there's more to the story for Realty Income? Head over to our Community to see what others are saying!
This article by Simply Wall St is general in nature. We provide commentary based on historical data and analyst forecasts only using an unbiased methodology and our articles are not intended to be financial advice. It does not constitute a recommendation to buy or sell any stock, and does not take account of your objectives, or your financial situation. We aim to bring you long-term focused analysis driven by fundamental data. Note that our analysis may not factor in the latest price-sensitive company announcements or qualitative material. Simply Wall St has no position in any stocks mentioned.
Have feedback on this article? Concerned about the content? Get in touch with us directly. Alternatively, email editorial-team@simplywallst.com