
Is Nintendo’s Stock Price Justified After 45% Jump and Next Console Hype?
- Wondering if Nintendo stock is truly worth its current price tag and where it could be heading next? You are not alone. This is a stock that always keeps investors guessing about hidden value and future upside.
- After climbing an impressive 51.6% over the past year and leaping 45.2% so far in 2024, Nintendo’s share price has cooled just slightly in recent weeks, down 0.8% for the past week and up 1.1% over the last month.
- Recent excitement around Nintendo’s upcoming console announcement and blockbuster franchise updates, like fresh details on the next installment in the Zelda series, have stoked optimism and sparked continued buzz across gaming communities. Headlines also highlight Nintendo’s renewed efforts to monetize legacy content, giving investors fresh context for its steady momentum.
- On our valuation checks, Nintendo earns a 1/6 score, suggesting only one undervalued metric out of six. There is a lot more beneath the surface, though, and we are about to break down the most common valuation methods for Nintendo, with an even better approach revealed at the end of this article.
Nintendo scores just 1/6 on our valuation checks. See what other red flags we found in the full valuation breakdown.
Approach 1: Nintendo Discounted Cash Flow (DCF) Analysis
The Discounted Cash Flow (DCF) model estimates a company's value by projecting its future cash flows and discounting them back to today's value. This approach helps investors gauge whether a stock is trading above or below what those future earnings are truly worth now.
Nintendo's current Free Cash Flow stands at ¥138.2 billion. Analyst forecasts and extended estimates suggest Nintendo’s Free Cash Flow could reach roughly ¥992.2 billion by 2035, with several step-wise increases along the way. The model takes into account analyst estimates for five years, then extends projections using reasonable growth assumptions to map out the next decade.
Using these forecasts, the DCF model calculates an intrinsic value for Nintendo of ¥10,815 per share. However, this figure is around 21.8% below the current share price. Based on expected cash flows, the stock appears overvalued according to this methodology.
Result: OVERVALUED
Our Discounted Cash Flow (DCF) analysis suggests Nintendo may be overvalued by 21.8%. Discover 928 undervalued stocks or create your own screener to find better value opportunities.

Approach 2: Nintendo Price vs Earnings (PE)
The Price-to-Earnings (PE) ratio is a popular metric for valuing established, profitable companies like Nintendo because it directly compares what investors are willing to pay for each unit of current earnings. This is especially useful when a company is consistently profitable, as is the case with Nintendo.
Generally, a company’s PE ratio will be higher if investors expect faster growth or perceive less risk compared to others. Conversely, a lower PE might reflect slower expected growth, higher risk, or weaker profitability. Benchmarks such as peer averages and industry averages offer some context, but they do not capture the whole story.
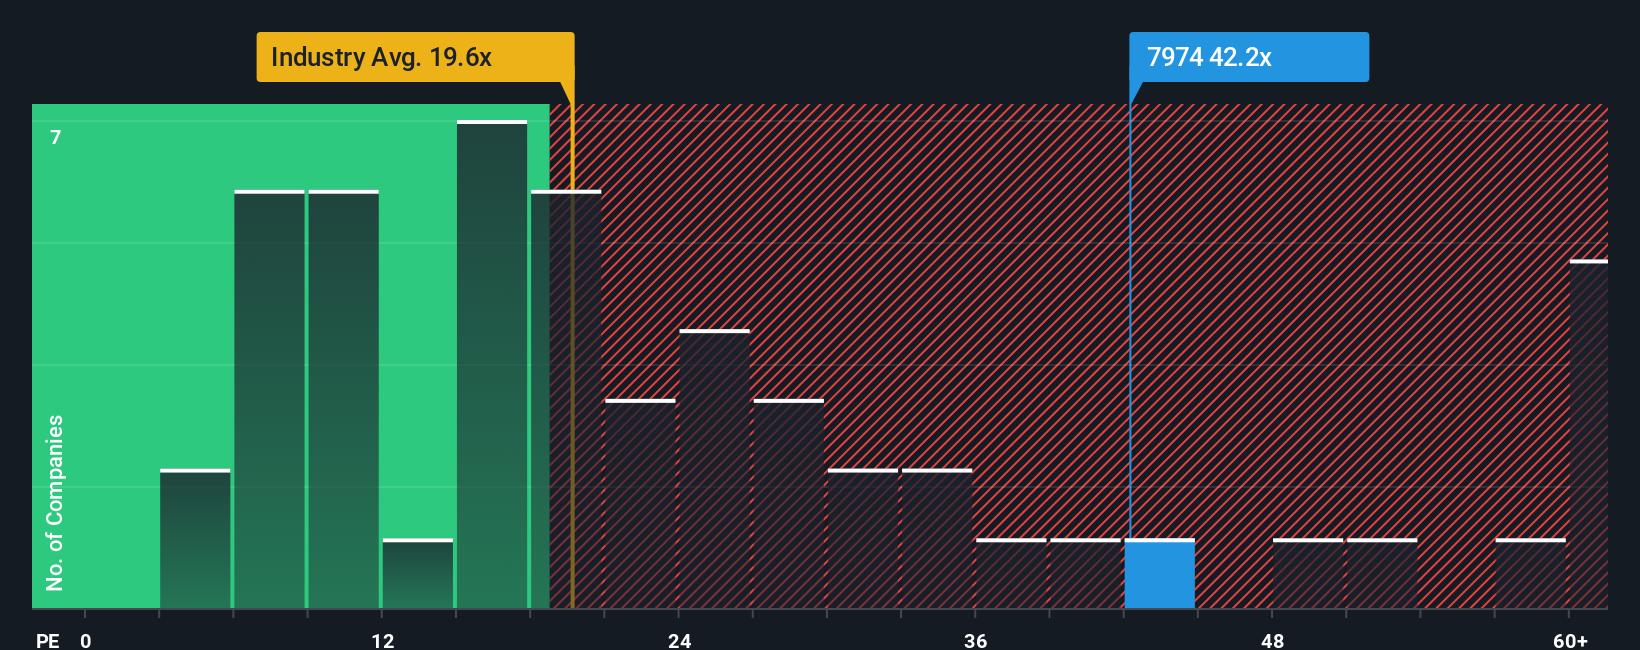
Nintendo’s current PE ratio stands at 41.5x. This is noticeably above the Entertainment industry average of 20.2x and also higher than Nintendo’s peer group average of 35x. However, Simply Wall St’s proprietary “Fair Ratio,” which factors in Nintendo’s earnings growth, profit margins, industry positioning, market capitalization, and risk profile, comes in at 46.3x. The fair ratio helps adjust for nuances that simple peer and sector averages cannot capture.
Comparing Nintendo’s actual PE ratio (41.5x) to the Fair Ratio (46.3x), the stock is trading a bit below what would be justified by its underlying fundamentals, growth forecast, and risk profile. This suggests Nintendo is potentially undervalued when using this more comprehensive lens.
Result: UNDERVALUED
PE ratios tell one story, but what if the real opportunity lies elsewhere? Discover 1440 companies where insiders are betting big on explosive growth.
Upgrade Your Decision Making: Choose your Nintendo Narrative
Earlier we mentioned that there is an even better way to understand valuation, so let's introduce you to Narratives. A Narrative is simply your own story of what you believe about a company and its future. It connects your opinions and outlook to specific financial forecasts, like future revenue and profit margins, and from there, to a fair value for the stock.
Narratives bridge the gap between numbers and bigger-picture thinking by tying a company’s prospects, risks, and competitive advantages to a dynamic financial forecast, making it easy to see how your view shapes what you think Nintendo is really worth. Narratives are simple, accessible, and available for everyone to try on Simply Wall St's Community page, where millions of investors share their perspectives.
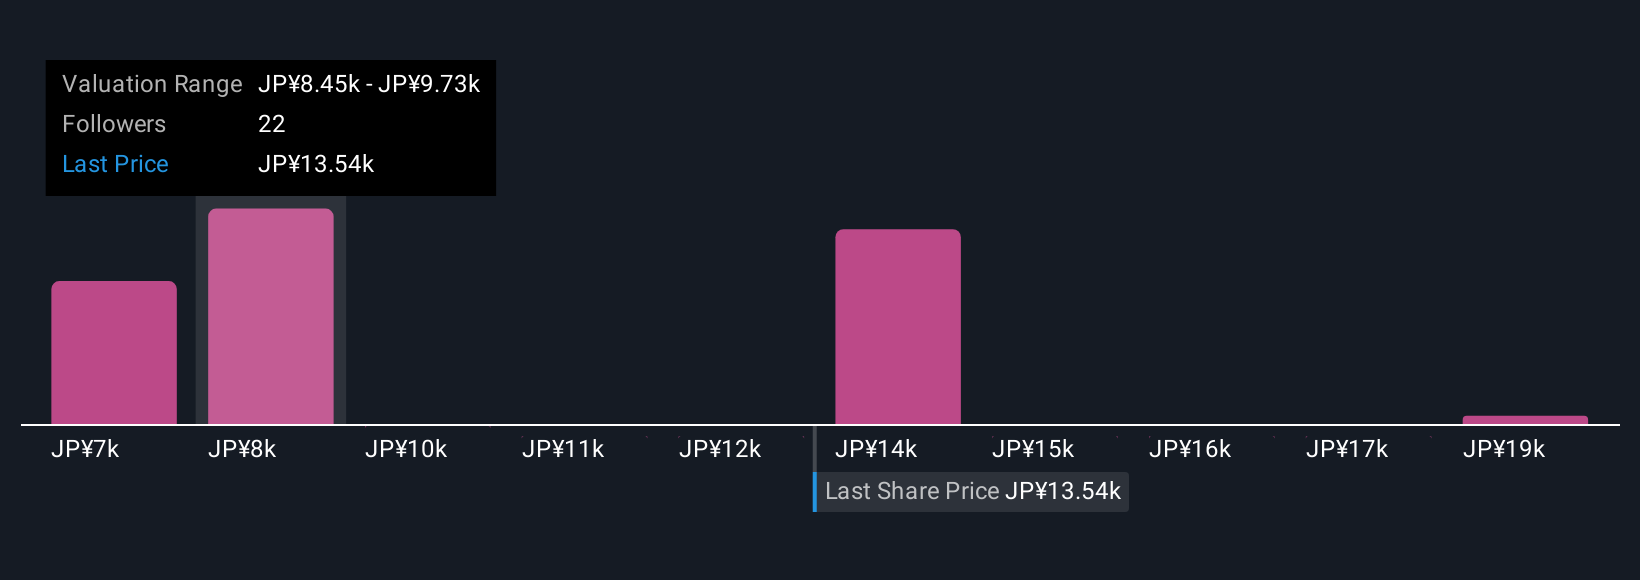
Because Narratives let you compare your “Fair Value” to the current market price, they help you decide if it is a smart time to buy, hold, or sell. They automatically update as news, earnings, and industry changes come in. For example, one investor’s Narrative for Nintendo might see fair value as high as ¥12,000 per share based on big console wins and movie success, while another sees it closer to ¥7,600, citing competition and slower growth.
Do you think there's more to the story for Nintendo? Head over to our Community to see what others are saying!
This article by Simply Wall St is general in nature. We provide commentary based on historical data and analyst forecasts only using an unbiased methodology and our articles are not intended to be financial advice. It does not constitute a recommendation to buy or sell any stock, and does not take account of your objectives, or your financial situation. We aim to bring you long-term focused analysis driven by fundamental data. Note that our analysis may not factor in the latest price-sensitive company announcements or qualitative material. Simply Wall St has no position in any stocks mentioned.
Have feedback on this article? Concerned about the content? Get in touch with us directly. Alternatively, email editorial-team@simplywallst.com