
Does Amphenol’s 101% Price Surge Reflect Its True Value After 5G Expansion News?
- If you have ever wondered whether Amphenol’s share price truly reflects its value, you are not alone, and you are in exactly the right place to dig deeper.
- After a staggering 101.0% jump year-to-date and an impressive 92.2% return over the last year, Amphenol's stock has been on quite a run. This performance has certainly turned heads and raised questions about what is driving those gains.
- Recent press coverage has put the spotlight on Amphenol’s expanding presence in high-growth sectors like 5G infrastructure and electric vehicles, fueling optimism among investors. At the same time, analysts continue to highlight the company’s successful acquisition strategy as a key factor behind the recent surge in valuation.
- Despite all this excitement, Amphenol scores a modest 1 out of 6 on our valuation checklist. Let’s walk through the usual valuation approaches and consider a perspective that just might be a better way to judge value.
Amphenol scores just 1/6 on our valuation checks. See what other red flags we found in the full valuation breakdown.
Approach 1: Amphenol Discounted Cash Flow (DCF) Analysis
A Discounted Cash Flow (DCF) model estimates what a company is worth by projecting its future cash flows and discounting them back to their value today. For Amphenol, this involves evaluating the company's ongoing ability to generate cash and estimating how much those future flows are worth in today's terms.
Currently, Amphenol reports a Free Cash Flow (FCF) of approximately $3.67 billion. Analyst estimates project steady growth, with cash flow expected to reach $4.69 billion in 2026 and $6.85 billion by the end of 2029. Beyond those years, projections are extrapolated and continue to reflect an upward trajectory, indicating stable operations and an expanding market presence.
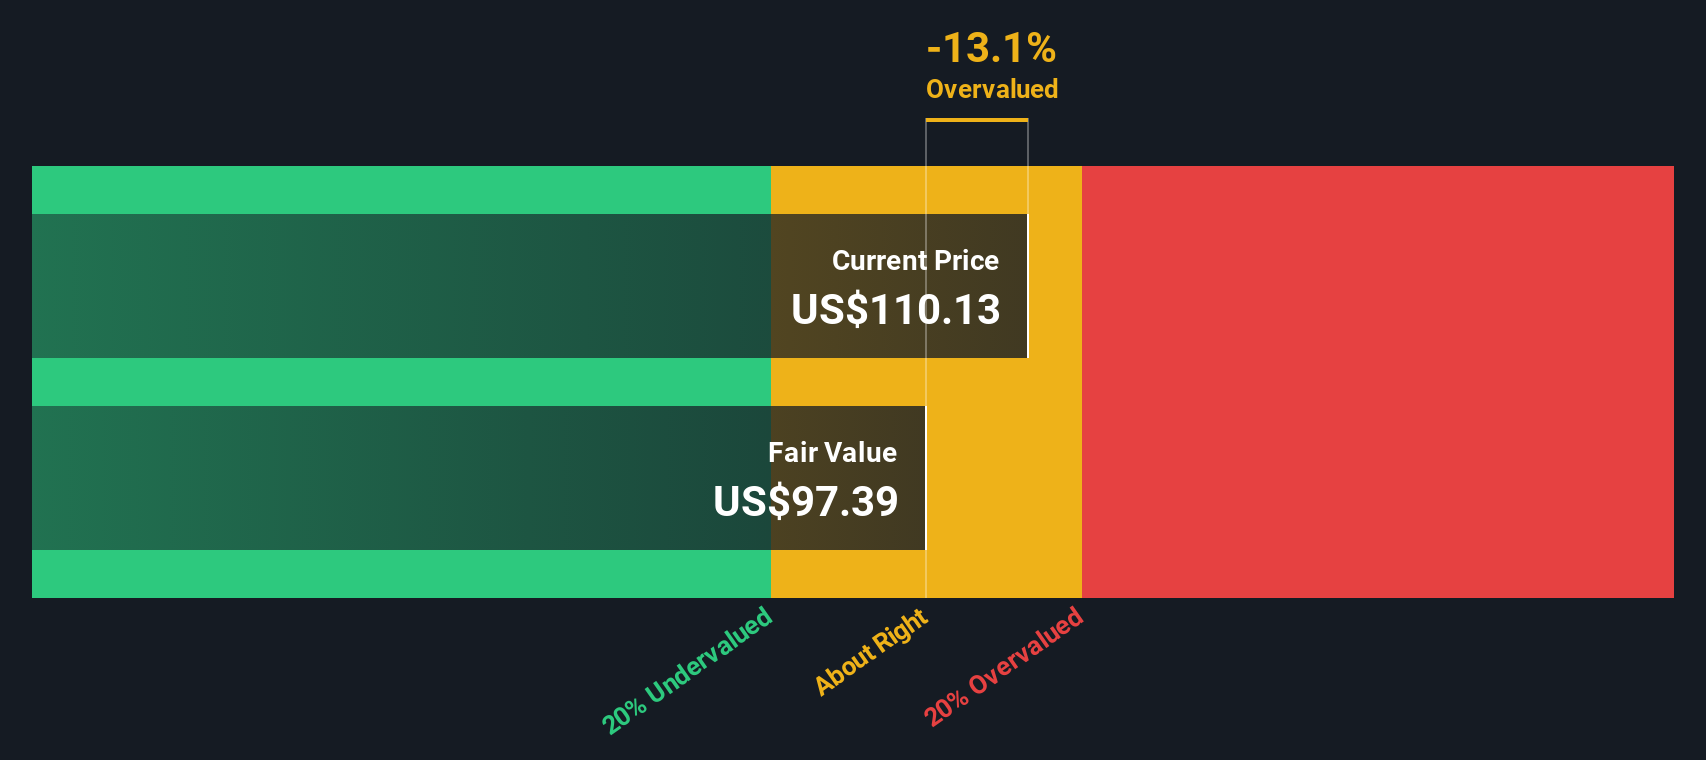
All these future numbers are discounted back to the present using a proven financial formula. The DCF model yields an estimated intrinsic value of $103.91 per share. With Amphenol's current price running about 33.5% above this level, the implication is that the stock may be significantly overvalued based on projected cash flows.
Result: OVERVALUED
Our Discounted Cash Flow (DCF) analysis suggests Amphenol may be overvalued by 33.5%. Discover 927 undervalued stocks or create your own screener to find better value opportunities.
Approach 2: Amphenol Price vs Earnings (PE)
The Price-to-Earnings (PE) ratio is a widely accepted method for valuing profitable companies like Amphenol because it measures how much investors are willing to pay today for a dollar of future earnings. This makes it especially useful for companies with strong, consistent profits, as it allows for easy comparison across peers and industries.
Growth expectations and perceived risk are crucial in shaping what counts as a "normal" or "fair" PE ratio. Companies expected to deliver higher future earnings growth or perceived as less risky typically command a premium, resulting in higher PE ratios. Conversely, slower-growing or riskier companies usually trade at lower PEs.
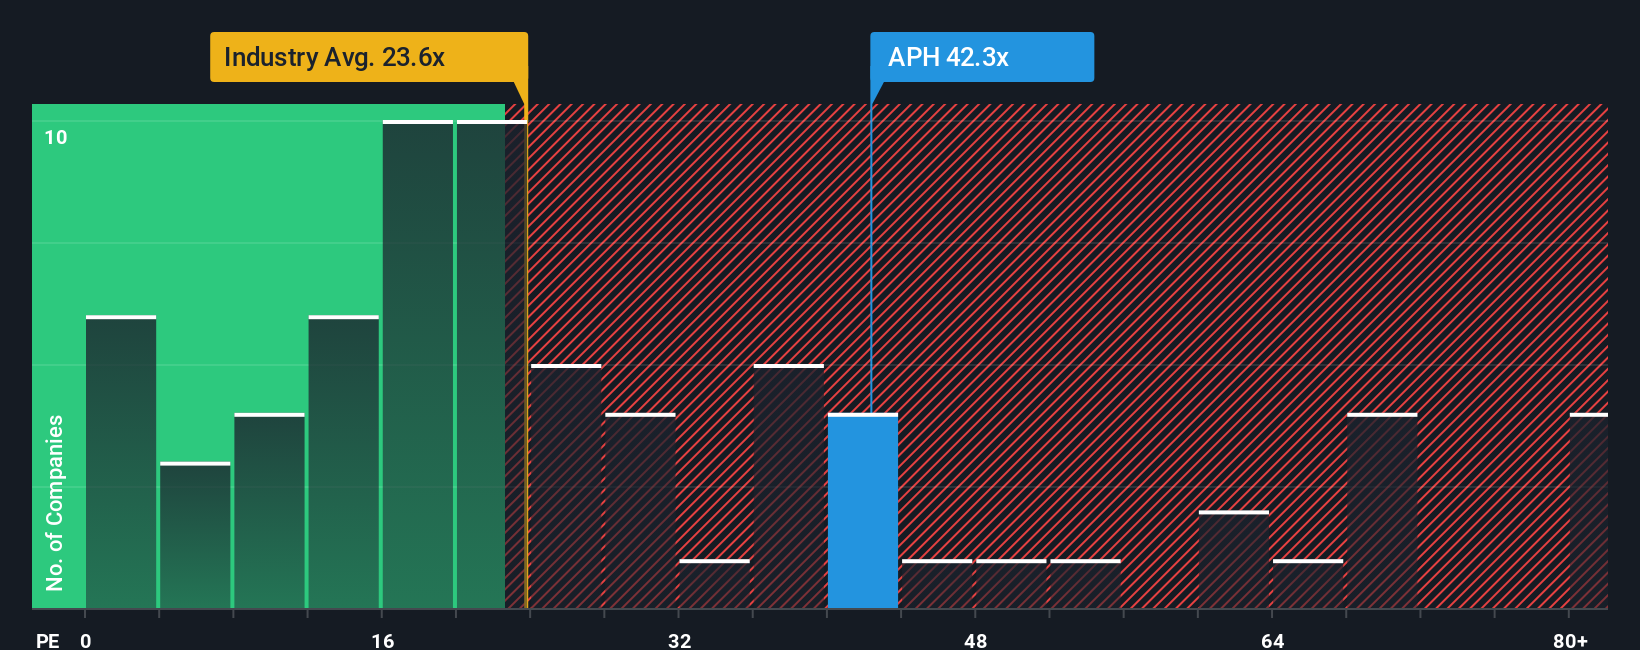
At present, Amphenol trades at a PE ratio of 44.4x. This is notably higher than the electronic industry average of 24.7x and the peer average of 82.6x. Simply Wall St’s proprietary "Fair Ratio" for Amphenol stands at 38.9x, reflecting nuanced factors such as the company’s earnings growth prospects, profit margins, industry characteristics and market capitalization.
Unlike straightforward peer or industry comparisons, the Fair Ratio goes deeper by considering the unique profile of Amphenol across growth, risk and profitability dimensions. This tailored approach helps cut through the noise and provides investors with a more meaningful benchmark for “fair value.”
With Amphenol’s actual PE ratio only modestly above its Fair Ratio, the stock appears slightly overvalued on this metric, but not excessively so.
Result: OVERVALUED
PE ratios tell one story, but what if the real opportunity lies elsewhere? Discover 1433 companies where insiders are betting big on explosive growth.
Upgrade Your Decision Making: Choose your Amphenol Narrative
Earlier we mentioned that there is an even better way to understand valuation. Let us introduce you to Narratives. A Narrative is simply the story you believe about a company, translated into your own assumptions for its future revenue, margins, and fair value. It is your personal perspective behind the numbers. Tools like those on Simply Wall St's Community page make Narratives accessible to everyone, allowing you to connect the company's real-world potential to your forecast and see how your fair value compares to the current share price.
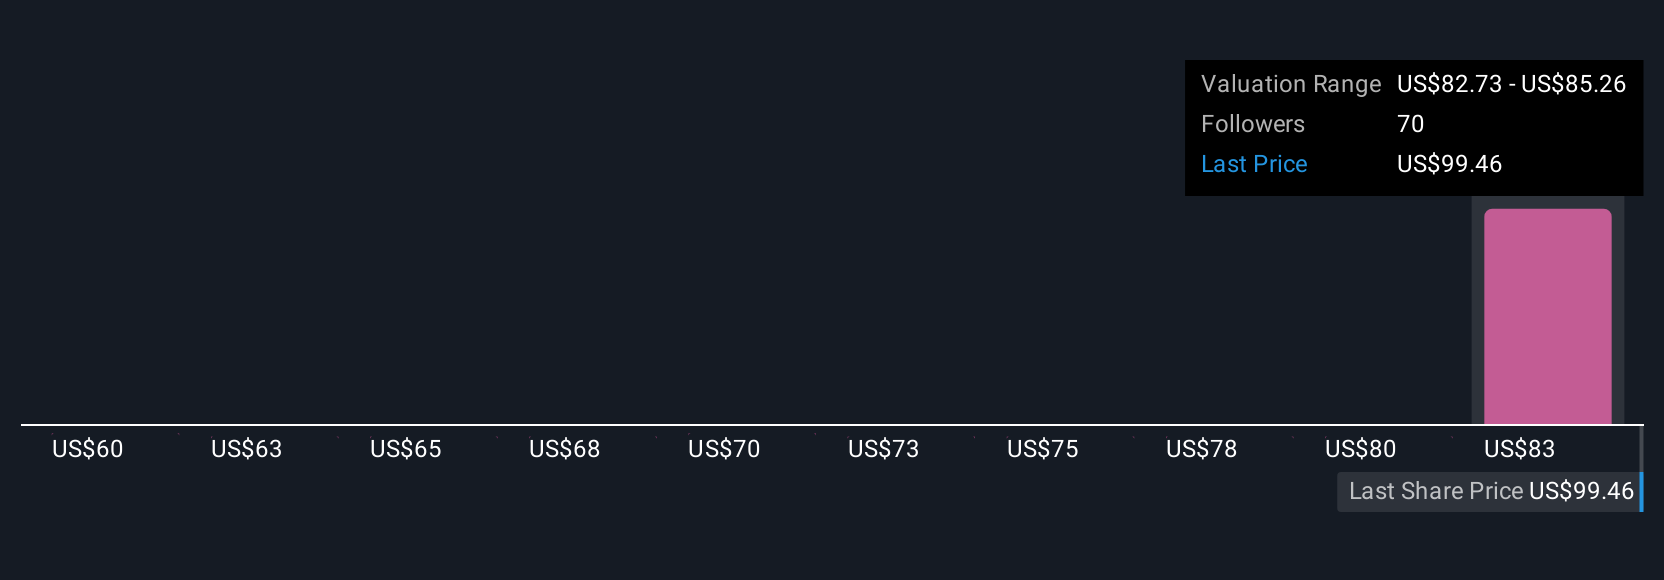
Narratives help you decide when to take action by comparing your fair value to the market price and automatically update as fresh news, earnings, or events occur, keeping your outlook current. For example, Amphenol's most optimistic investors expect the stock to reach $134, assuming strong demand and successful expansion, while the most cautious see fair value as low as $85 due to competitive and cyclical risks. Narratives allow you to express your own view, test analyst consensus, and track how your fair value changes as new data emerges, empowering you to make smarter, more dynamic investment decisions.
Do you think there's more to the story for Amphenol? Head over to our Community to see what others are saying!
This article by Simply Wall St is general in nature. We provide commentary based on historical data and analyst forecasts only using an unbiased methodology and our articles are not intended to be financial advice. It does not constitute a recommendation to buy or sell any stock, and does not take account of your objectives, or your financial situation. We aim to bring you long-term focused analysis driven by fundamental data. Note that our analysis may not factor in the latest price-sensitive company announcements or qualitative material. Simply Wall St has no position in any stocks mentioned.
Have feedback on this article? Concerned about the content? Get in touch with us directly. Alternatively, email editorial-team@simplywallst.com