
Ensign Group (ENSG): Exploring Valuation After Fed Comments and Rising Investor Confidence
Ensign Group (ENSG) shares saw a boost following upbeat comments from a Federal Reserve official about possible interest rate cuts, which contributed to stronger investor sentiment across healthcare names. This shift comes as short interest in Ensign Group continues to fall.
See our latest analysis for Ensign Group.
Ensign Group's share price has been on a steady upward climb this year, jumping more than 40% year-to-date as investor sentiment steadily improves and risk perceptions ease. Recent positive momentum, supported by easing short interest and sector tailwinds, helps solidify its reputation as one of the more resilient healthcare performers. A three-year total shareholder return of 98% highlights its long-term strength.
With the healthcare sector in focus, it’s a great opportunity to check out similar companies. Explore the full landscape with our See the full list for free..
With the stock making significant gains and optimism taking hold, investors are now asking whether Ensign Group’s current price leaves room for further upside or if the market has already priced in its future growth potential.
Price-to-Earnings of 32.8x: Is it justified?
Ensign Group’s shares now trade at a price-to-earnings (PE) ratio of 32.8x, which is substantially higher than both its direct peers and the broader US healthcare industry. This elevated multiple reflects strong investor expectations for continued earnings growth.
The price-to-earnings ratio serves as a gauge of how much investors are willing to pay for every dollar of current earnings. In the healthcare sector, a higher PE may signal expected growth or perceived resilience, but it can also point to potential overvaluation if future results do not meet these lofty expectations.
At 32.8x earnings, Ensign Group is considerably more expensive than the US healthcare industry average of 22.7x and its peer group average of 19.2x. Furthermore, this is above the estimated fair price-to-earnings ratio of 24.7x. This level is one that the market could drift toward if growth momentum slows.
Explore the SWS fair ratio for Ensign Group
Result: Price-to-Earnings of 32.8x (OVERVALUED)
However, slower-than-expected earnings growth or a reversal in healthcare sector sentiment could quickly challenge the stock’s current momentum and lofty valuation.
Find out about the key risks to this Ensign Group narrative.
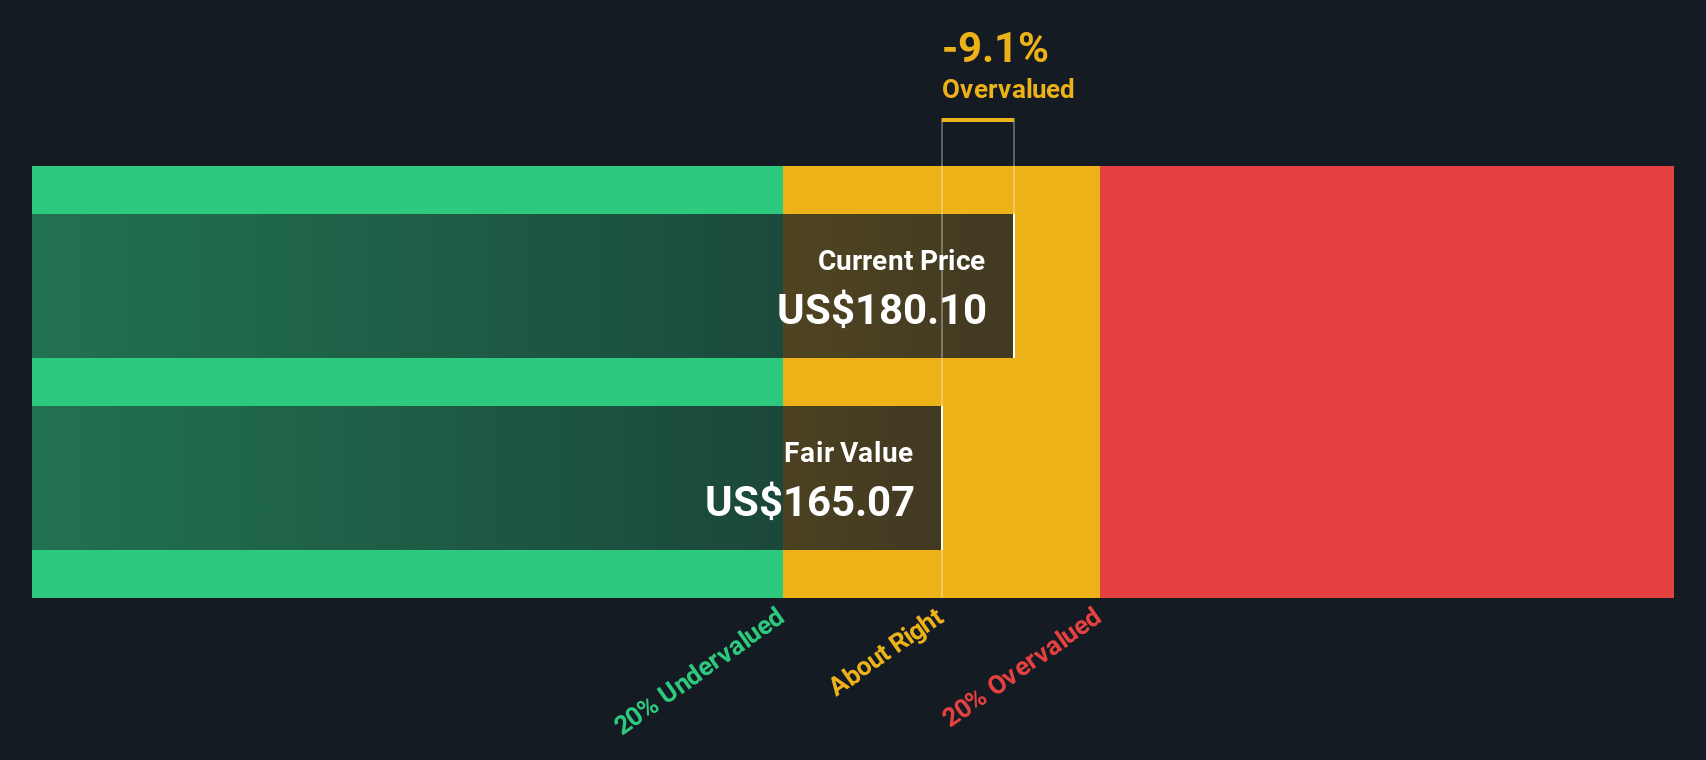
Another View: DCF Suggests Undervaluation
While the price-to-earnings ratio shows Ensign Group looking expensive compared to peers, our DCF model presents a different perspective. According to this approach, Ensign Group is trading about 9.8% below its estimated fair value. Could this signal a hidden value opportunity, or is the multiple telling the real story?
Look into how the SWS DCF model arrives at its fair value.
Simply Wall St performs a discounted cash flow (DCF) on every stock in the world every day (check out Ensign Group for example). We show the entire calculation in full. You can track the result in your watchlist or portfolio and be alerted when this changes, or use our stock screener to discover 927 undervalued stocks based on their cash flows. If you save a screener we even alert you when new companies match - so you never miss a potential opportunity.
Build Your Own Ensign Group Narrative
If you want to dig into the numbers or see things from a different perspective, you can easily build your own view of Ensign Group’s outlook in just minutes. Do it your way
A good starting point is our analysis highlighting 3 key rewards investors are optimistic about regarding Ensign Group.
Looking for more investment ideas?
Don’t let opportunity pass you by. There are other compelling stocks that could help you get ahead of the trend. Use the insights from our screeners to guide your next smart investment move.
- Catch early-stage momentum by starting with these 3581 penny stocks with strong financials featuring robust financials positioned to break out.
- Tap into the fast-evolving AI frontier by scanning these 25 AI penny stocks set to benefit from advances in artificial intelligence.
- Boost your portfolio's income potential by targeting these 15 dividend stocks with yields > 3% with above-average yields and a proven record of rewarding shareholders.
This article by Simply Wall St is general in nature. We provide commentary based on historical data and analyst forecasts only using an unbiased methodology and our articles are not intended to be financial advice. It does not constitute a recommendation to buy or sell any stock, and does not take account of your objectives, or your financial situation. We aim to bring you long-term focused analysis driven by fundamental data. Note that our analysis may not factor in the latest price-sensitive company announcements or qualitative material. Simply Wall St has no position in any stocks mentioned.
Have feedback on this article? Concerned about the content? Get in touch with us directly. Alternatively, email editorial-team@simplywallst.com