
Is Barrick Gold Still a Bargain After 139.8% 2025 Rally and New Partnerships?
- Ever wondered whether Barrick Mining might be a hidden gem or already priced for perfection? Let’s dig into what the numbers and the story behind them could be telling us about its real worth.
- The Barrick Mining share price has been on a tear lately, with a 139.8% gain year-to-date and 127.7% over the past year. This has caught the attention of investors looking for both momentum and value.
- Recent headlines spotlight Barrick’s ambitious sustainability targets and large-scale exploration projects, reassuring some investors while sparking debate about long-term industry risks. Key partnerships and newly secured mining rights have added fresh fuel to the rally, putting the company back in the market’s spotlight.
- When it comes to valuation, Barrick Mining scores a 5 out of 6 on our core undervaluation checks. However, there is more to valuation than scorecards alone, and we’ll dig deeper into the methods and a smarter way to interpret them later in the article.
Approach 1: Barrick Mining Discounted Cash Flow (DCF) Analysis
The Discounted Cash Flow (DCF) model estimates a company's intrinsic value by projecting future cash flows and discounting them back to today’s value. By doing this, it helps investors assess what a business is truly worth based on its ability to generate cash in the years ahead.
Currently, Barrick Mining’s Free Cash Flow stands at $2.57 Billion, making it a heavyweight in the industry. Analyst forecasts cover the next five years, predicting steady growth. By 2029, projections see Free Cash Flow reaching $9.07 Billion, with further growth extrapolated for subsequent years. These estimates are all expressed in US dollars, reflecting the company’s reporting currency.
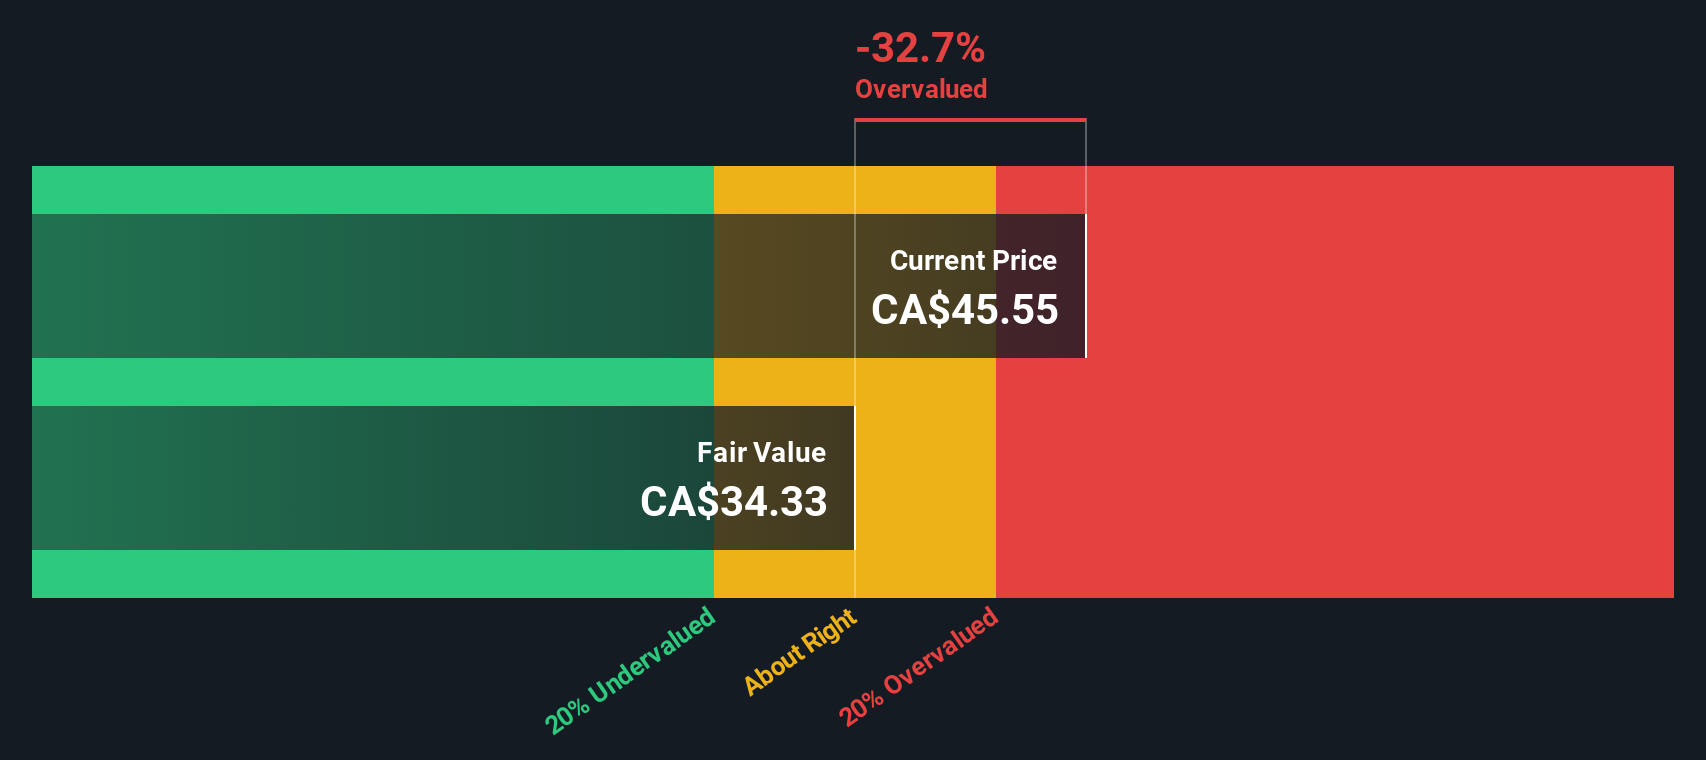
After applying the two-stage Free Cash Flow to Equity model, the DCF methodology arrives at an estimated intrinsic value of $202.22 per share. Compared to its current price, the DCF calculation reveals the stock is trading at a 72.7% discount, suggesting significant undervaluation based on the fundamentals alone.
Result: UNDERVALUED
Our Discounted Cash Flow (DCF) analysis suggests Barrick Mining is undervalued by 72.7%. Track this in your watchlist or portfolio, or discover 925 more undervalued stocks based on cash flows.
Approach 2: Barrick Mining Price vs Earnings (PE)
For profitable companies like Barrick Mining, the Price-to-Earnings (PE) ratio is a widely used and effective valuation metric. It relates the company’s share price to its per-share earnings, helping investors judge if the stock reflects reasonable expectations for future profitability.
The "normal" or fair PE ratio for a business depends on how quickly it is expected to grow and the risks it faces. Higher growth prospects or lower risks typically justify a higher PE, while slower growth or greater uncertainties call for a lower one.
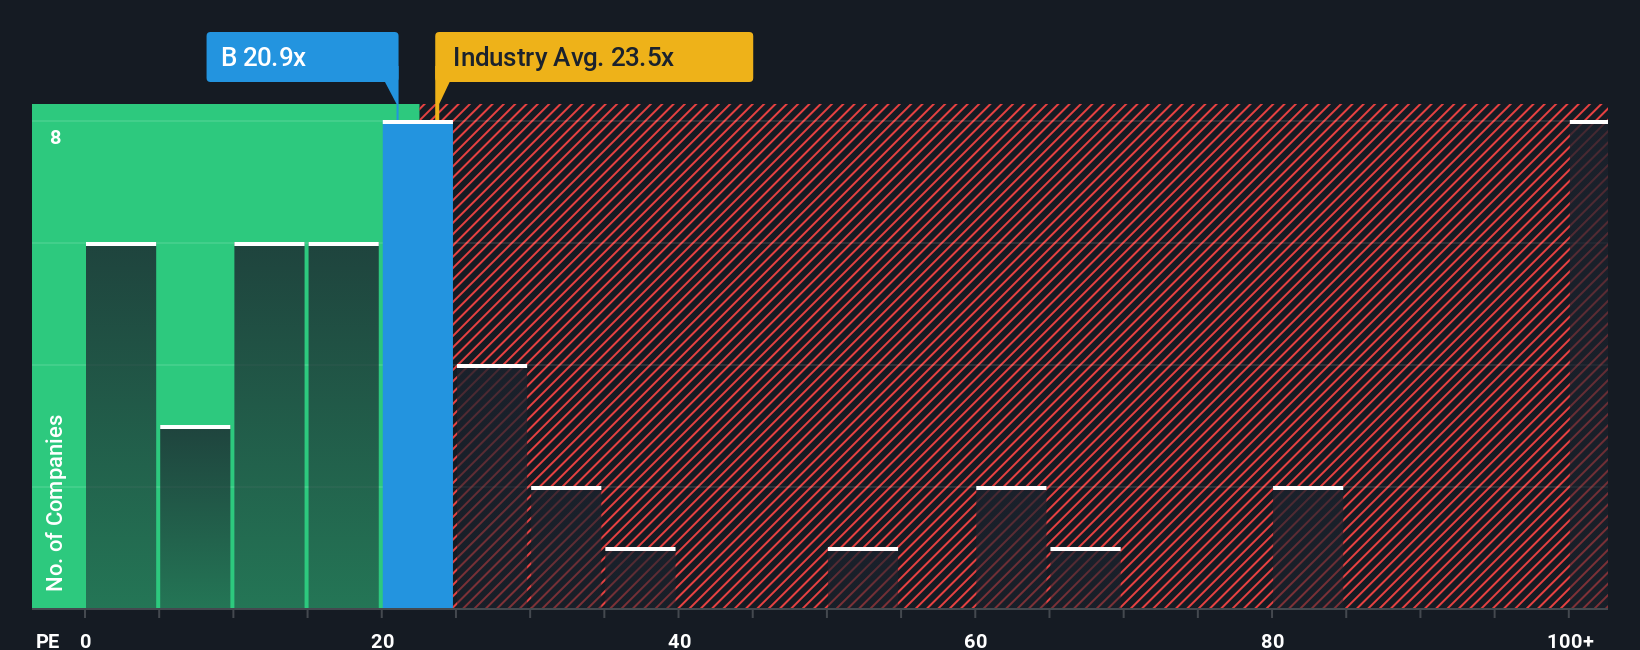
Barrick Mining currently trades at an 18.4x PE, compared to the Metals and Mining industry average of 19.2x and the peer average of 33.7x. This puts Barrick below typical peer valuations, but headline comparisons on their own can be misleading due to differences in risk, market cap, and growth profiles.
To provide a sharper lens, Simply Wall St’s “Fair Ratio” estimates where the company’s PE should land, based on factors like expected earnings growth, profit margin, industry trends, risk profile, and company size. Unlike straight industry or peer averages, this approach tailors the comparison to the business itself, allowing for a more clear and reliable benchmark.
For Barrick Mining, the Fair Ratio stands at 25.5x. Since the actual PE ratio is meaningfully lower than this, the stock appears clearly undervalued on this basis.
Result: UNDERVALUED
PE ratios tell one story, but what if the real opportunity lies elsewhere? Discover 1434 companies where insiders are betting big on explosive growth.
Upgrade Your Decision Making: Choose your Barrick Mining Narrative
Earlier we mentioned that there's an even better way to understand valuation, so let's introduce you to Narratives. Narratives are dynamic stories that investors create about a company, linking both their understanding of the company's direction and their own assumptions about its future financials, including fair value, projected revenue, earnings, and margins.
Rather than simply relying on static numbers or consensus price targets, a Narrative gives you a structured way to connect all the information: the company's business story, your forecasts, and what you believe the share should be worth. Narratives are made simple on Simply Wall St's Community page. Millions of investors use them to document their perspectives and to see how fair value changes as new information appears, such as news or earnings updates.
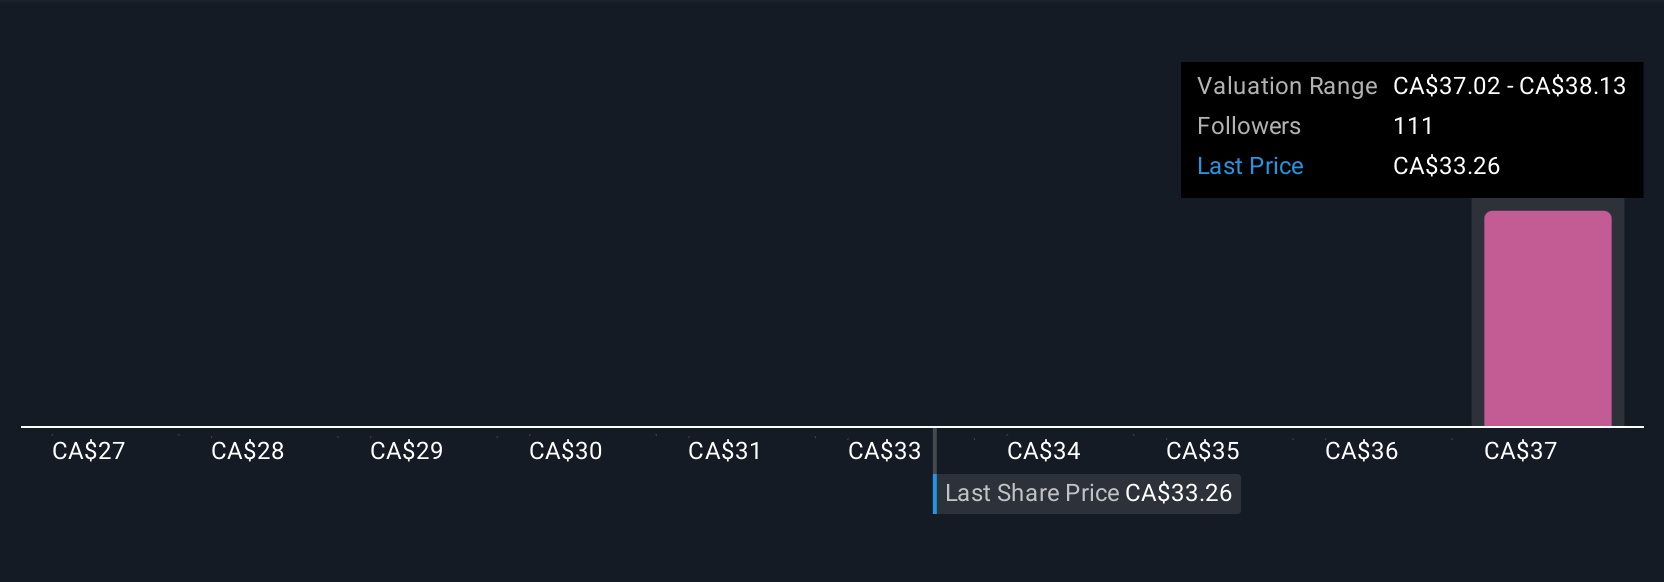
This approach empowers you to compare your estimated fair value with today's price, helping you make smarter, more timely buy or sell decisions. For example, some Barrick Mining Narratives currently set fair value as high as $60, reflecting optimism about rising gold demand and safe-haven dynamics. Others are more cautious, suggesting fair value could be just $31 if risks materialize or margins disappoint.
Do you think there's more to the story for Barrick Mining? Head over to our Community to see what others are saying!
This article by Simply Wall St is general in nature. We provide commentary based on historical data and analyst forecasts only using an unbiased methodology and our articles are not intended to be financial advice. It does not constitute a recommendation to buy or sell any stock, and does not take account of your objectives, or your financial situation. We aim to bring you long-term focused analysis driven by fundamental data. Note that our analysis may not factor in the latest price-sensitive company announcements or qualitative material. Simply Wall St has no position in any stocks mentioned.
Have feedback on this article? Concerned about the content? Get in touch with us directly. Alternatively, email editorial-team@simplywallst.com