
What Do Recent AI Chip Design Partnerships Mean for Cadence’s Valuation in 2025?
- Wondering if Cadence Design Systems is a hidden gem or priced to perfection? You're not alone. We are going to dive into the details to see where the value lies.
- The stock has seen some ups and downs, dropping 3.4% over the past week and down 12.9% over the past month. It is still up slightly for the year and has delivered impressive gains of 82.2% over three years and 158.5% over five years.
- Recent news around major industry partnerships and the growing demand for electronic design automation tools has put Cadence back in the spotlight. Investors are weighing the company's competitive edge against emerging tech trends. Headlines have highlighted Cadence's involvement in chip design for AI and next-generation semiconductors, fueling speculation about future growth opportunities.
- Right now, Cadence Design Systems scores just 1 out of 6 on our undervaluation checks, suggesting there is more to the story than meets the eye. Next, we will break down traditional valuation metrics, but stick around for an even smarter approach to understanding what this stock is really worth.
Cadence Design Systems scores just 1/6 on our valuation checks. See what other red flags we found in the full valuation breakdown.
Approach 1: Cadence Design Systems Discounted Cash Flow (DCF) Analysis
The Discounted Cash Flow (DCF) model estimates a company's intrinsic value by projecting its future cash flows and discounting them back to today's dollars. This approach aims to capture what the business is really worth based on the cash it can generate for shareholders, not just its current market sentiment.
For Cadence Design Systems, the DCF analysis uses the 2 Stage Free Cash Flow to Equity method. The company's latest reported Free Cash Flow (FCF) stands at $1.47 Billion. Analyst estimates see FCF growing to $2.44 Billion by the end of 2029, and ten-year forecasts, which are part analyst consensus and part extrapolation by Simply Wall St, suggest cash flows could reach $3.18 Billion by 2035. While analyst projections reach five years out, further growth estimates are based on model extrapolation.
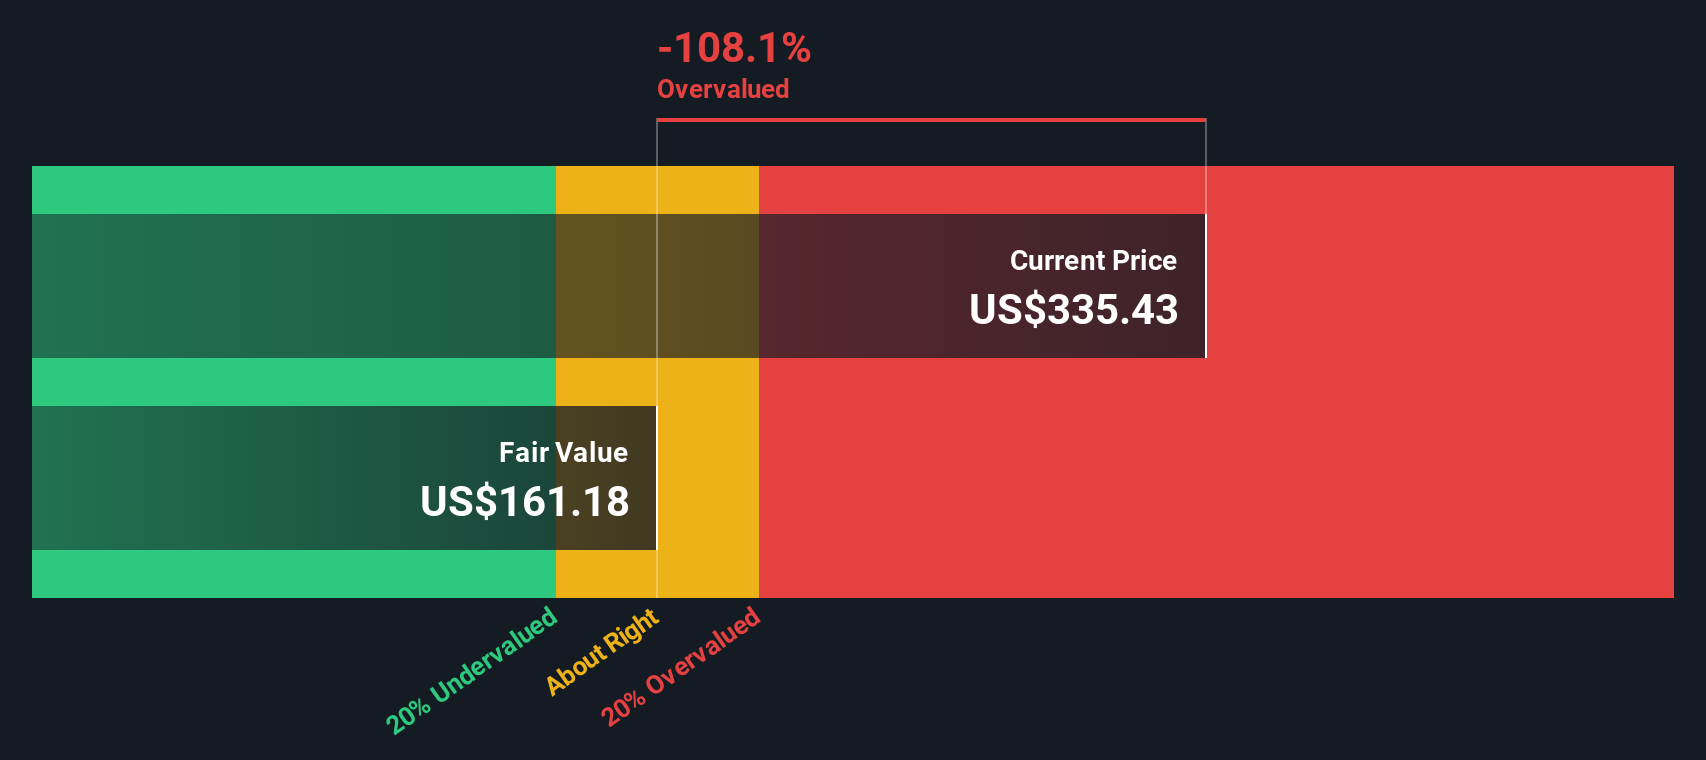
The DCF model delivers a fair value estimate of $163.20 per share. Compared to current market pricing, this implies Cadence Design Systems stock is about 84.2% overvalued on this basis, meaning its share price far exceeds what long-term cash flow projections would support.
Result: OVERVALUED
Our Discounted Cash Flow (DCF) analysis suggests Cadence Design Systems may be overvalued by 84.2%. Discover 927 undervalued stocks or create your own screener to find better value opportunities.
Approach 2: Cadence Design Systems Price vs Earnings
For profitable technology companies like Cadence Design Systems, the Price-to-Earnings (PE) ratio is a go-to valuation metric. It provides a clear snapshot of how much investors are willing to pay now for each dollar of the company's trailing earnings. This makes it especially relevant when the business consistently generates positive profits.
It is important to remember that growth outlook and perceived risk both influence what constitutes a “fair” PE ratio. Fast-growing companies tend to command higher PE multiples. In contrast, firms with slower prospects or higher risk carry lower ones as the market factors in future uncertainty.
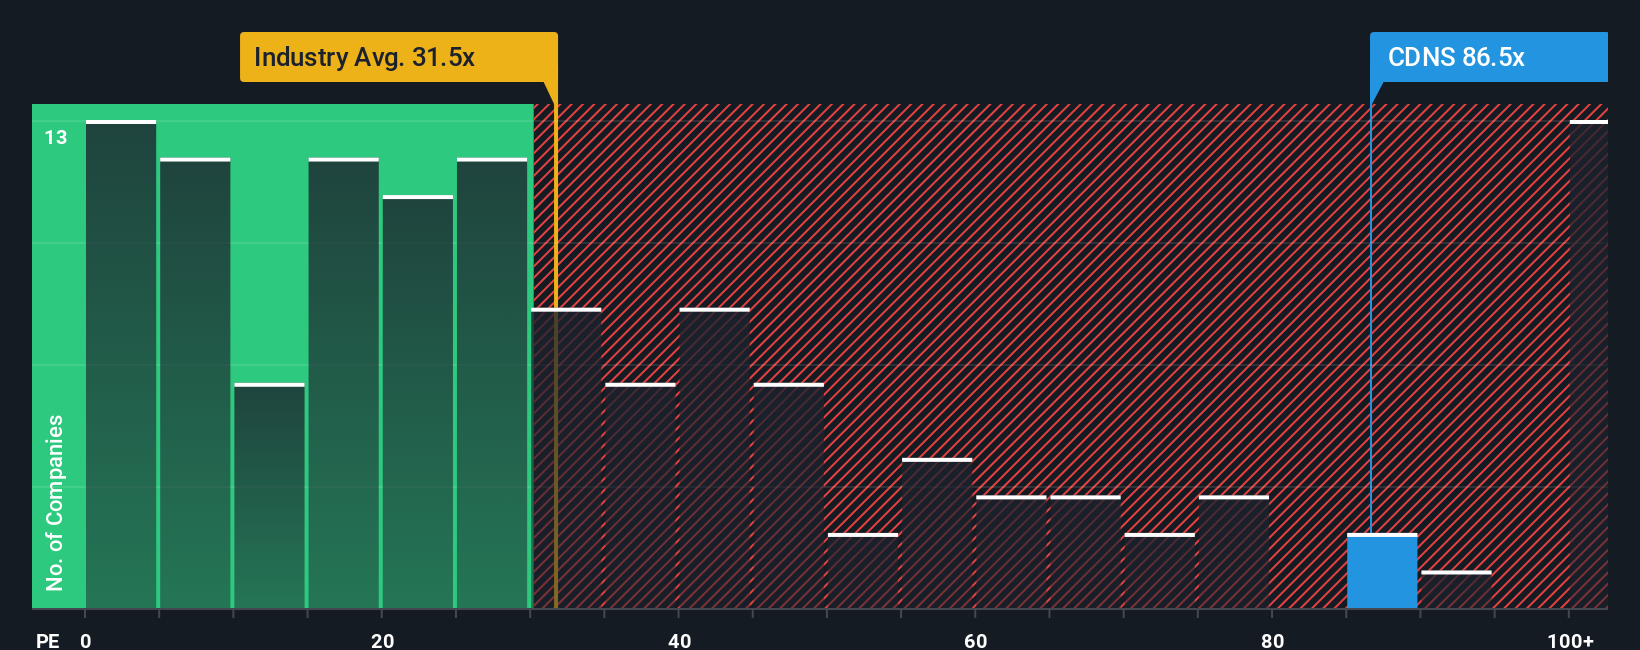
Cadence currently trades at a PE ratio of 77.1x. For context, this is significantly above the Software industry average of 28.8x and the peer average of 60.9x. However, comparing multiples to a broad industry benchmark can be misleading without accounting for specifics like earnings growth potential, profit margins, or the company’s size.
This is where the Simply Wall St “Fair Ratio” comes in. The Fair Ratio for Cadence is calculated at 42.6x, drawing from a proprietary methodology that considers the company’s unique growth outlook, risk factors, profitability, and position in the broader industry. Unlike a simple comparison to industry averages or selected peers, the Fair Ratio provides a more holistic and calibrated perspective on what Cadence “should” be trading at, based on its fundamentals and context.
With the current PE multiple of 77.1x well above the Fair Ratio of 42.6x, the stock appears significantly overvalued using this approach.
Result: OVERVALUED
PE ratios tell one story, but what if the real opportunity lies elsewhere? Discover 1434 companies where insiders are betting big on explosive growth.
Upgrade Your Decision Making: Choose your Cadence Design Systems Narrative
Earlier we mentioned that there is an even better way to understand valuation. Let us introduce you to Narratives, a dynamic, user-driven approach that connects a company's unique story with financial forecasts and an estimated fair value.
A Narrative allows you to define your view of Cadence Design Systems by combining your own expectations about future revenue, earnings, and margins with the company’s broader business context. This results in a completely personalized estimate of what the stock is truly worth. Narratives are more powerful than just crunching numbers because they help you see how shifts in technology, leadership, partnerships, or industry trends might change Cadence’s future and its fair value.
Available right on Simply Wall St’s Community page, used by millions of investors, Narratives make it easy for anyone to create, share, and explore perspectives that update automatically as new earnings reports or news emerge. With Narratives, you can quickly compare your personal fair value to the current share price to decide when to buy or sell, and see how your thesis stacks up against the crowd.
For example, some investors believe ongoing demand for AI-driven design tools justifies a fair value near $410, while others are more cautious about risks and set their estimate closer to $200. This demonstrates how Narratives can reflect a wide range of informed opinions and strategies.
Do you think there's more to the story for Cadence Design Systems? Head over to our Community to see what others are saying!

This article by Simply Wall St is general in nature. We provide commentary based on historical data and analyst forecasts only using an unbiased methodology and our articles are not intended to be financial advice. It does not constitute a recommendation to buy or sell any stock, and does not take account of your objectives, or your financial situation. We aim to bring you long-term focused analysis driven by fundamental data. Note that our analysis may not factor in the latest price-sensitive company announcements or qualitative material. Simply Wall St has no position in any stocks mentioned.
Have feedback on this article? Concerned about the content? Get in touch with us directly. Alternatively, email editorial-team@simplywallst.com