
Brookfield Asset Management (TSX:BAM): Evaluating Valuation After Recent Share Price Weakness
Brookfield Asset Management (TSX:BAM) shares have recently caught the attention of investors seeking strong, income-generating businesses. With diverse operations and steady revenue growth, Brookfield’s recent performance draws renewed curiosity about its stock’s long-term outlook.
See our latest analysis for Brookfield Asset Management.
BAM’s share price has been under pressure lately, with a 30-day share price return of -5.81% and a year-to-date return of -9.20% reflecting recent market caution. At the same time, the business continues to deliver steady revenue growth. The 1-year total shareholder return of -5.48% highlights a period of lost momentum but does not erase Brookfield’s long-term strengths.
If you’re interested in finding more opportunities with strong growth potential, now’s a good moment to discover fast growing stocks with high insider ownership
Yet with shares trading below analyst price targets and fundamentals showing continued revenue growth, the question now becomes: Is Brookfield Asset Management undervalued at these levels, or is the market already factoring in its future growth?
Price-to-Earnings of 31.1x: Is it justified?
Brookfield Asset Management is currently trading at a price-to-earnings (P/E) ratio of 31.1x, a notable premium to both its peers and the wider industry. This premium pricing suggests investors are paying significantly more for each dollar of BAM’s earnings compared to competitors.
The P/E ratio reflects how much investors are willing to pay today for a company’s future earnings power. For asset managers and capital markets firms, it is an especially relevant metric, as it captures the market’s expectations for sustained profit growth and business resilience.
BAM’s P/E multiple is not only higher than the peer average of 46.8x, but also above the estimated fair P/E ratio of 27.8x. While this could indicate confidence in the company’s growth trajectory, it can also signal over-optimism if BAM’s future earnings fall short of high expectations established by the market’s valuation.
Compared with the broader Canadian Capital Markets industry, where the average P/E ratio is just 8.7x, BAM’s valuation looks even steeper. If the market moves closer to BAM’s fair P/E, current investors could face limited upside in the near term.
Explore the SWS fair ratio for Brookfield Asset Management
Result: Price-to-Earnings of 31.1x (OVERVALUED)
However, market volatility and slowing net income growth could limit Brookfield’s upside. It is important for investors to monitor future earnings reports closely.
Find out about the key risks to this Brookfield Asset Management narrative.
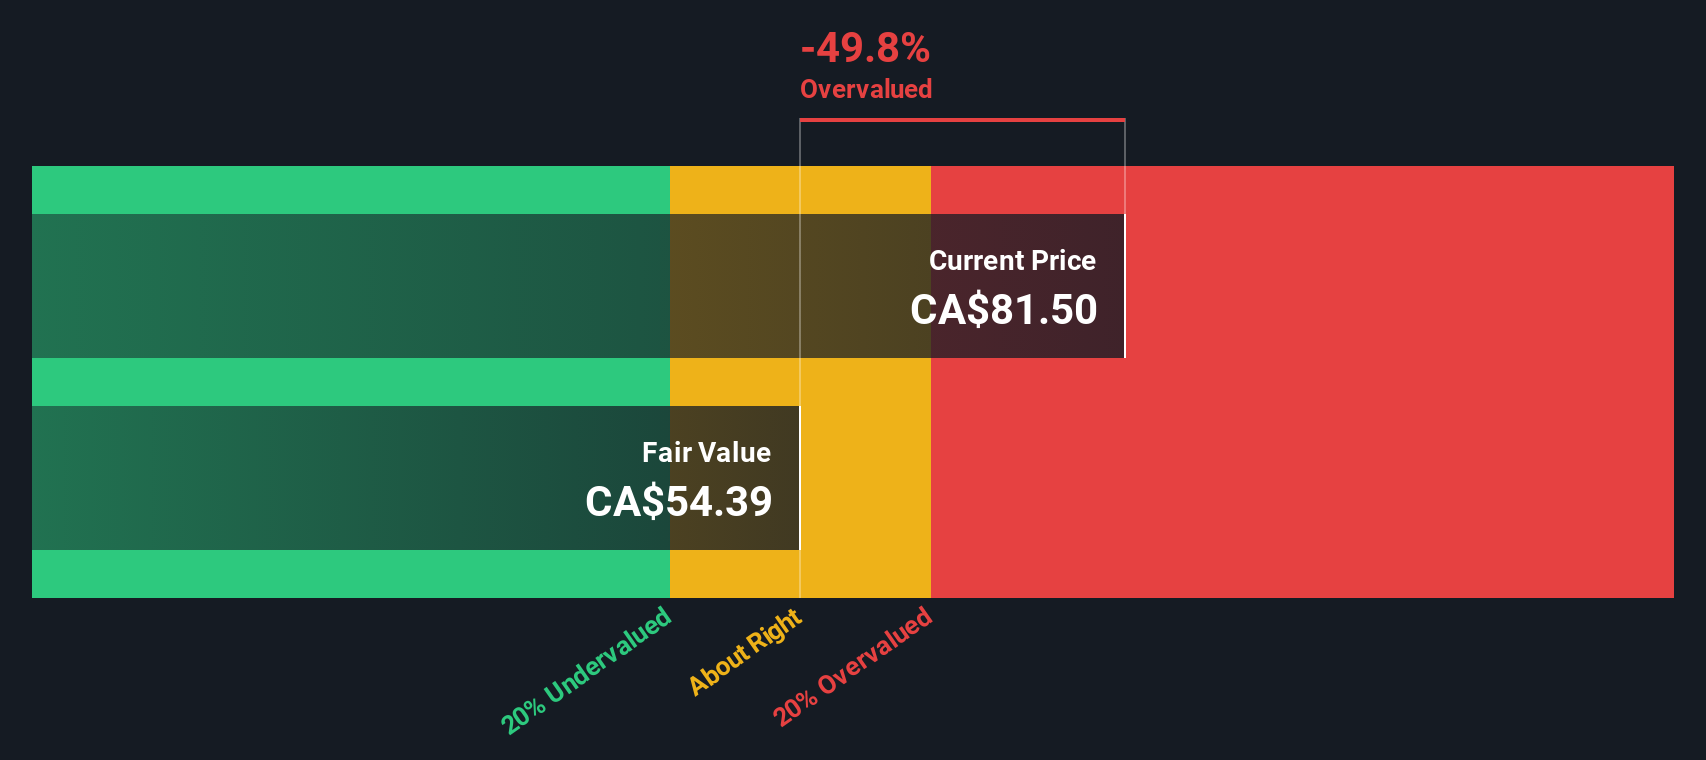
Another View: Discounted Cash Flow Tells a Different Story
While the market’s price-to-earnings perspective suggests Brookfield Asset Management looks pricey, our DCF model estimates a fair value of CA$60.79, which is below its current share price of CA$71.12. By this measure, the shares may be overvalued, challenging the optimism implied by earnings multiples.
Look into how the SWS DCF model arrives at its fair value.
Simply Wall St performs a discounted cash flow (DCF) on every stock in the world every day (check out Brookfield Asset Management for example). We show the entire calculation in full. You can track the result in your watchlist or portfolio and be alerted when this changes, or use our stock screener to discover 918 undervalued stocks based on their cash flows. If you save a screener we even alert you when new companies match - so you never miss a potential opportunity.
Build Your Own Brookfield Asset Management Narrative
If you want to dig deeper, or believe your perspective is different, you can examine the latest numbers and build your own market view in under three minutes with Do it your way.
A great starting point for your Brookfield Asset Management research is our analysis highlighting 2 key rewards and 2 important warning signs that could impact your investment decision.
Looking for More Investment Ideas?
Move beyond the obvious and give yourself the edge by checking out other strategies that investors are using right now to spot high-potential opportunities.
- Uncover potential gains in the rapidly advancing AI sector with these 25 AI penny stocks as these artificial intelligence leaders shape tomorrow’s markets.
- Tap into lucrative passive income streams by targeting these 17 dividend stocks with yields > 3%, which offers strong yields for income-focused investors.
- Get ahead of the curve by exploring these 81 cryptocurrency and blockchain stocks and position your portfolio at the forefront of digital innovation.
This article by Simply Wall St is general in nature. We provide commentary based on historical data and analyst forecasts only using an unbiased methodology and our articles are not intended to be financial advice. It does not constitute a recommendation to buy or sell any stock, and does not take account of your objectives, or your financial situation. We aim to bring you long-term focused analysis driven by fundamental data. Note that our analysis may not factor in the latest price-sensitive company announcements or qualitative material. Simply Wall St has no position in any stocks mentioned.
Have feedback on this article? Concerned about the content? Get in touch with us directly. Alternatively, email editorial-team@simplywallst.com