
Is Marvell Technology a Better Value After Recent 10% Share Price Drop?
- Wondering if Marvell Technology's recent slide has created a buying opportunity or revealed some hidden risks? You are not alone, since a lot of investors are asking the same question right now.
- After a sharp drop of 10.4% in the past week and 4.4% in the last month, Marvell's shares are now down 31.8% so far this year. This has erased much of the prior momentum seen over the past three and five years.
- Tech sector headlines have focused on Marvell recently, with significant market volatility and shifting sentiment toward semiconductor stocks as AI adoption accelerates across the industry. Broader economic concerns and changing expectations for tech hardware demand are also influencing Marvell’s price moves, making it important to look past the day-to-day noise.
- Currently, Marvell's valuation score is 2 out of 6. This suggests there are only select areas where the stock might actually be undervalued. We will break down how that score is calculated and how it compares to other ways of valuing Marvell Technology, but stick around because there may be an even better way to understand its true value at the end of this article.
Marvell Technology scores just 2/6 on our valuation checks. See what other red flags we found in the full valuation breakdown.
Approach 1: Marvell Technology Discounted Cash Flow (DCF) Analysis
The Discounted Cash Flow (DCF) model estimates a company's intrinsic value by projecting its future cash flows and discounting them back to today. This method aims to determine what Marvell Technology is truly worth based on its capacity to generate cash over time, rather than relying solely on market trends or sector sentiment.
For Marvell Technology, its most recent annual Free Cash Flow stands at $1.48 billion. Analyst projections expect this figure to rise consistently, reaching $4.23 billion by January 2030. It is important to note that estimates for the next five years are sourced directly from analysts. Further projections out to 2035 are calculated based on growth assumptions. This two-stage approach helps provide a long-term perspective on the company’s financial health and growth prospects.
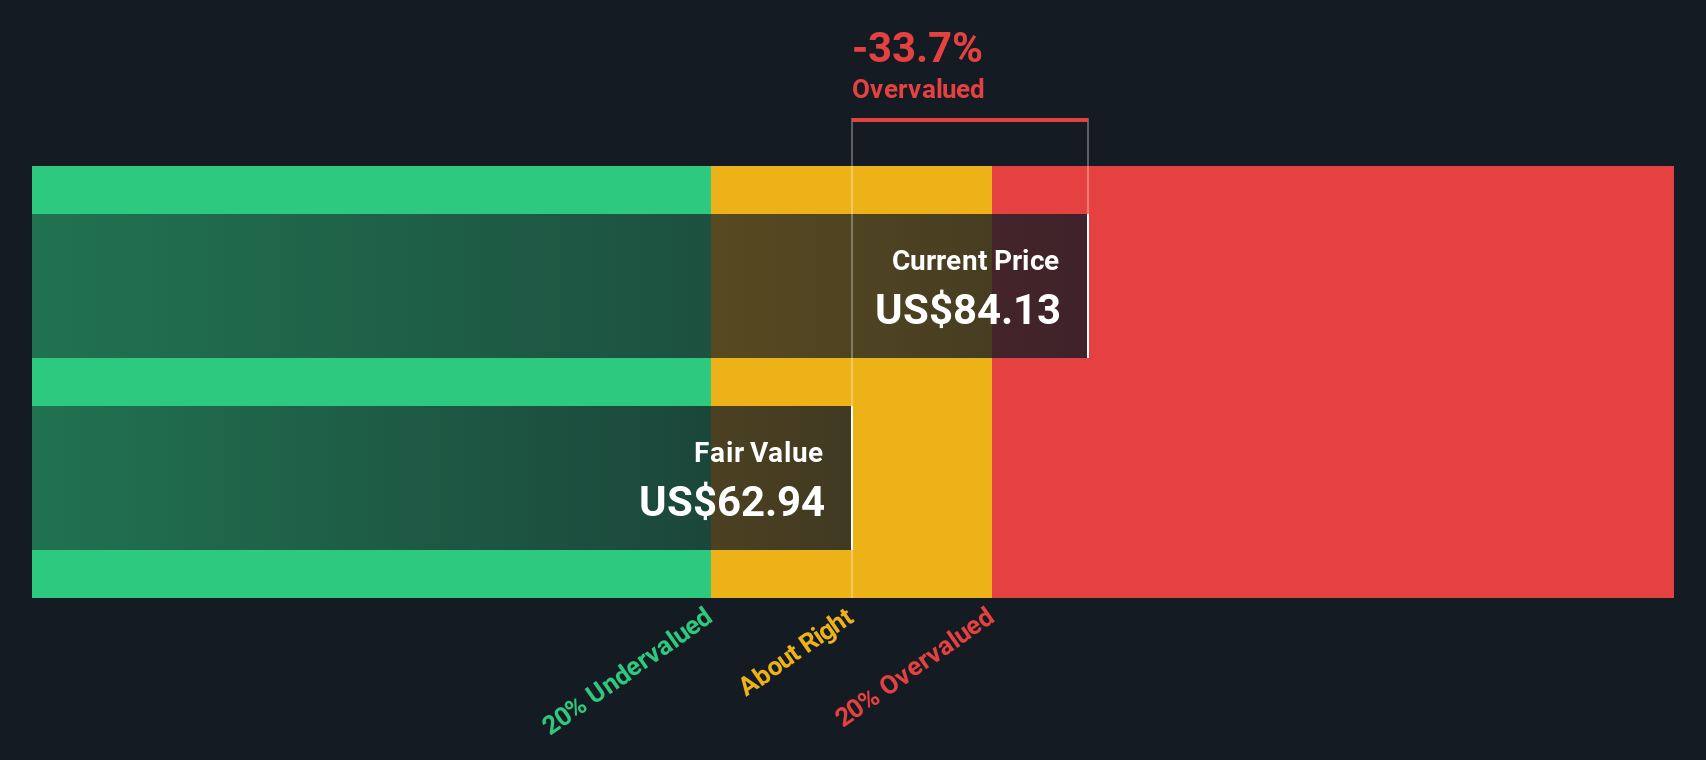
According to this DCF model, the calculated fair value per share for Marvell Technology is $59.96. However, based on recent market prices, the stock sits approximately 29.2% above its calculated intrinsic value. This suggests that Marvell Technology's shares are currently overvalued according to the cash flow analysis.
Result: OVERVALUED
Our Discounted Cash Flow (DCF) analysis suggests Marvell Technology may be overvalued by 29.2%. Discover 918 undervalued stocks or create your own screener to find better value opportunities.
Approach 2: Marvell Technology Price vs Sales (P/S) Ratio
The Price-to-Sales (P/S) ratio is a commonly used valuation metric for companies like Marvell Technology, particularly when consistent profitability is still developing or earnings are volatile. It helps investors compare a stock’s price to its actual revenue, making it useful for assessing growth-focused tech firms in the semiconductor industry.
Growth expectations and risk play a big role in determining what a “normal” or “fair” P/S ratio should be. Higher growth rates can justify a premium multiple, while greater risks or slowing growth often warrant a discount. Investors often compare a company’s P/S ratio to industry averages or peers for a baseline assessment.
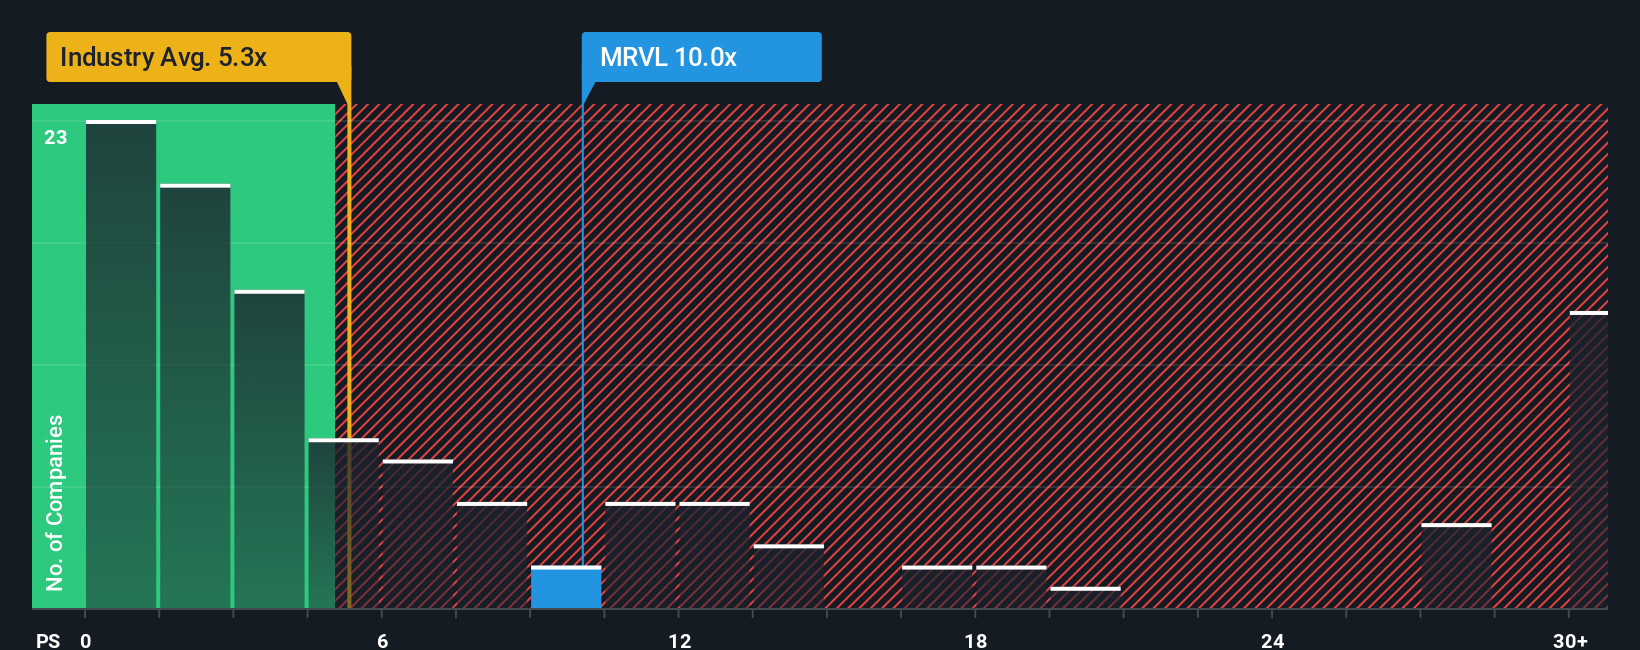
Currently, Marvell Technology trades at a P/S ratio of 9.23x. For context, the semiconductor industry average is 4.24x, while the average among Marvell’s peer group sits at a much higher 15.59x. Simply Wall St uses a proprietary “Fair Ratio” model to provide a more targeted benchmark, considering factors like Marvell’s growth outlook, industry profile, profit margins, market capitalization, and risk level. For Marvell, the Fair Ratio is 11.25x. This suggests that, given current conditions, its valuation should be closer to this figure rather than just the broad industry or peer averages.
This Fair Ratio approach offers a better read by reflecting the nuances of Marvell’s specific situation instead of relying solely on historical multiples of other companies. Comparing Marvell’s current P/S of 9.23x with its Fair Ratio of 11.25x suggests that the stock appears undervalued relative to what would be expected given its fundamentals.
Result: UNDERVALUED
PS ratios tell one story, but what if the real opportunity lies elsewhere? Discover 1422 companies where insiders are betting big on explosive growth.
Upgrade Your Decision Making: Choose your Marvell Technology Narrative
Earlier we mentioned there is an even better way to understand valuation. Now let's introduce you to Narratives, a more powerful and dynamic way to guide your investment decisions.
A Narrative is your personal investment story; it maps your specific perspective on Marvell Technology’s future, including your own expectations for fair value, future revenue, earnings, and profit margins. Instead of just relying on formulas or consensus estimates, Narratives connect what you believe about Marvell’s business outlook directly to forecasts and then to a transparent fair value calculation. This helps you see the impact of your viewpoint in real numbers.
Narratives are an easy, accessible tool available on Simply Wall St’s Community page and are used by millions of investors worldwide. They let you compare your estimated fair value to the current price, so you can quickly identify when your analysis says it is time to buy, hold, or sell. Even better, Narratives update automatically as new news and earnings come in, so your decision-making adapts to real-world events in real time.
For example, if you believe Marvell’s custom data center wins and AI tailwinds will rapidly accelerate earnings, your Narrative might support a fair value above $122 per share. A more cautious outlook could result in a fair value near $58.2; both views can coexist and evolve as new developments arise.
Do you think there's more to the story for Marvell Technology? Head over to our Community to see what others are saying!
This article by Simply Wall St is general in nature. We provide commentary based on historical data and analyst forecasts only using an unbiased methodology and our articles are not intended to be financial advice. It does not constitute a recommendation to buy or sell any stock, and does not take account of your objectives, or your financial situation. We aim to bring you long-term focused analysis driven by fundamental data. Note that our analysis may not factor in the latest price-sensitive company announcements or qualitative material. Simply Wall St has no position in any stocks mentioned.
Have feedback on this article? Concerned about the content? Get in touch with us directly. Alternatively, email editorial-team@simplywallst.com