
Is Netflix’s Value Justified After the New Ad Tier and Subscriber Growth Headlines?
- Wondering if Netflix is fairly priced, overhyped, or perhaps even a bargain right now? You’re definitely not alone. Countless investors are trying to pin down what it’s really worth.
- Netflix’s share price has had its ups and downs lately, losing 5.0% over the past week and dropping 11.2% in the last month, but still boasting impressive gains of 24.1% year-to-date and a massive 277.4% over three years.
- Recent headlines have zeroed in on Netflix's new ad-supported tier and its crackdown on password sharing. Both of these moves have pushed the company into fresh territory and impacted investor sentiment. The buzz around new subscriber growth and changing user behaviors has also played a part in these recent swings.
- On the numbers side, Netflix earns a valuation score of 2 out of 6, meaning it checks the undervalued box in just 2 key areas. Up next, we’ll dive into how different methods approach valuation, and later, I’ll share a smarter, more complete way to get the real picture.
Netflix scores just 2/6 on our valuation checks. See what other red flags we found in the full valuation breakdown.
Approach 1: Netflix Discounted Cash Flow (DCF) Analysis
The Discounted Cash Flow (DCF) model works by forecasting a company’s future cash flows, then discounting those projections back to today’s value using a rate that reflects risk and the time value of money. This helps investors estimate what a business is intrinsically worth based solely on its expected future financial performance.
For Netflix, the DCF model uses a two-stage approach that reflects higher growth in the early years and moderation in later years. The company’s current Free Cash Flow is around $9.1 Billion. Analysts expect this figure to grow substantially, with estimates projecting Netflix will generate nearly $20.6 Billion in free cash flow by the end of 2029. This would be more than double its current annual FCF. Cash flow projections beyond 2029 are extrapolated since analysts typically provide forward estimates for five years and, beyond that period, data from market sources like Simply Wall St fills the gap.
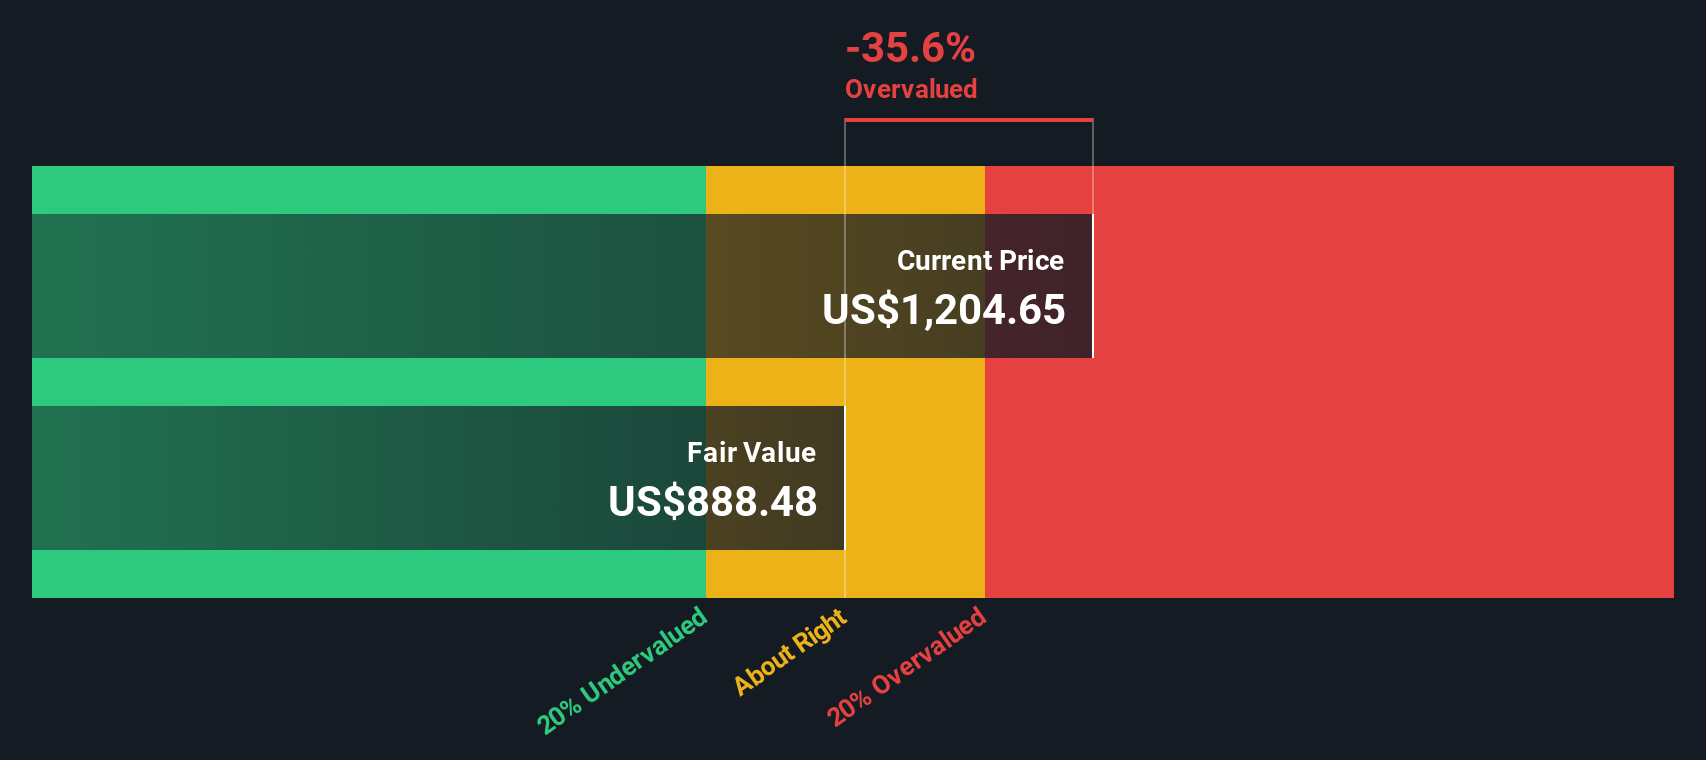
With all future cash flows weighed and discounted, the DCF model arrives at an intrinsic value of $86.48 per share for Netflix. Given where the shares trade now, this implies the stock is approximately 27.2% overvalued based on discounted future cash flows.
Result: OVERVALUED
Our Discounted Cash Flow (DCF) analysis suggests Netflix may be overvalued by 27.2%. Discover 896 undervalued stocks or create your own screener to find better value opportunities.
Approach 2: Netflix Price vs Earnings (PE)
For profitable companies like Netflix, the Price-to-Earnings (PE) ratio is often the go-to metric for valuation. This ratio measures how much investors are willing to pay for each dollar of the company’s earnings, giving a clear sense of how the market values Netflix’s profitability.
Expectations for future growth and risk play a big role in what is considered a “normal” or “fair” PE ratio. High-growth companies tend to trade at higher PE ratios, while higher risk or slowing growth tends to pull that number down. It is all about how much confidence investors have in future profits and how stable those earnings appear.
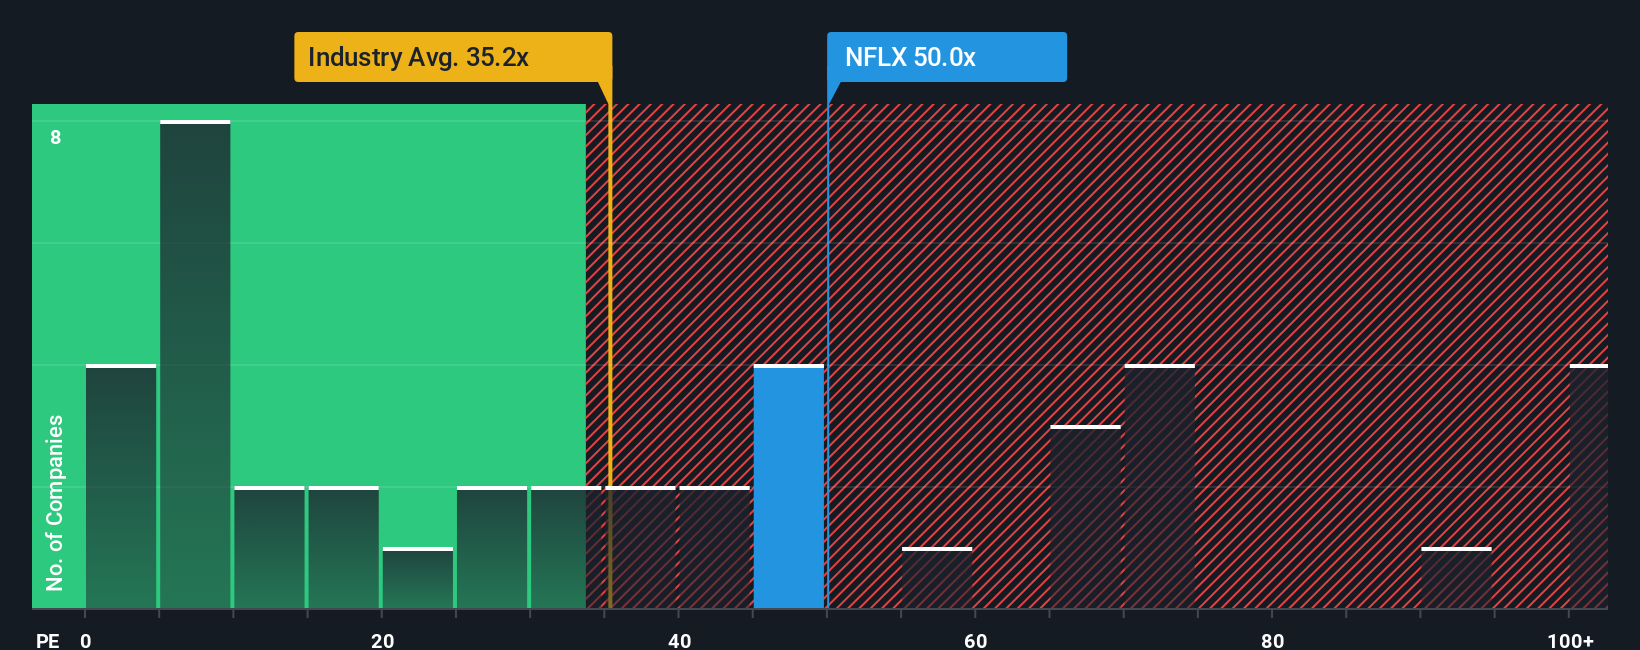
Right now, Netflix trades at a PE ratio of 44.7x. Compare that to the Entertainment industry average of just 19.7x, and even to Netflix’s peer group, which averages a hefty 76.1x. On the surface, Netflix is valued well above the typical company in its industry, but is still cheaper than some of its most direct rivals.
This is where the Simply Wall St proprietary “Fair Ratio” comes in. The Fair Ratio is calculated based on Netflix’s expected earnings growth, profit margins, market cap, and risk factors, and offers a more tailored benchmark. In this case, it stands at 36.4x. This is a more precise way to assess valuation, since it weighs not just the company’s sector but its real-world potential and business fundamentals.
Comparing Netflix’s actual PE of 44.7x with its Fair Ratio of 36.4x, the market is valuing its earnings quite a bit higher than what fundamentals alone suggest. That points to the stock being overpriced on a PE basis.
Result: OVERVALUED
PE ratios tell one story, but what if the real opportunity lies elsewhere? Discover 1417 companies where insiders are betting big on explosive growth.
Upgrade Your Decision Making: Choose your Netflix Narrative
Earlier we mentioned that there is an even better way to understand valuation, so let us introduce you to Narratives. A Narrative is a simple, story-driven approach that allows you to combine your unique view of a company, such as your assumptions for Netflix’s fair value, future revenue, earnings, and margins, with a personalized financial forecast.
Instead of just relying on fixed metrics, Narratives empower you to link Netflix’s business story to numbers and see a fair value based on your perspective. It is easy to get started, as Narratives are available to everyone directly on the Simply Wall St Community page, where millions of investors share, debate, and update their investment stories.
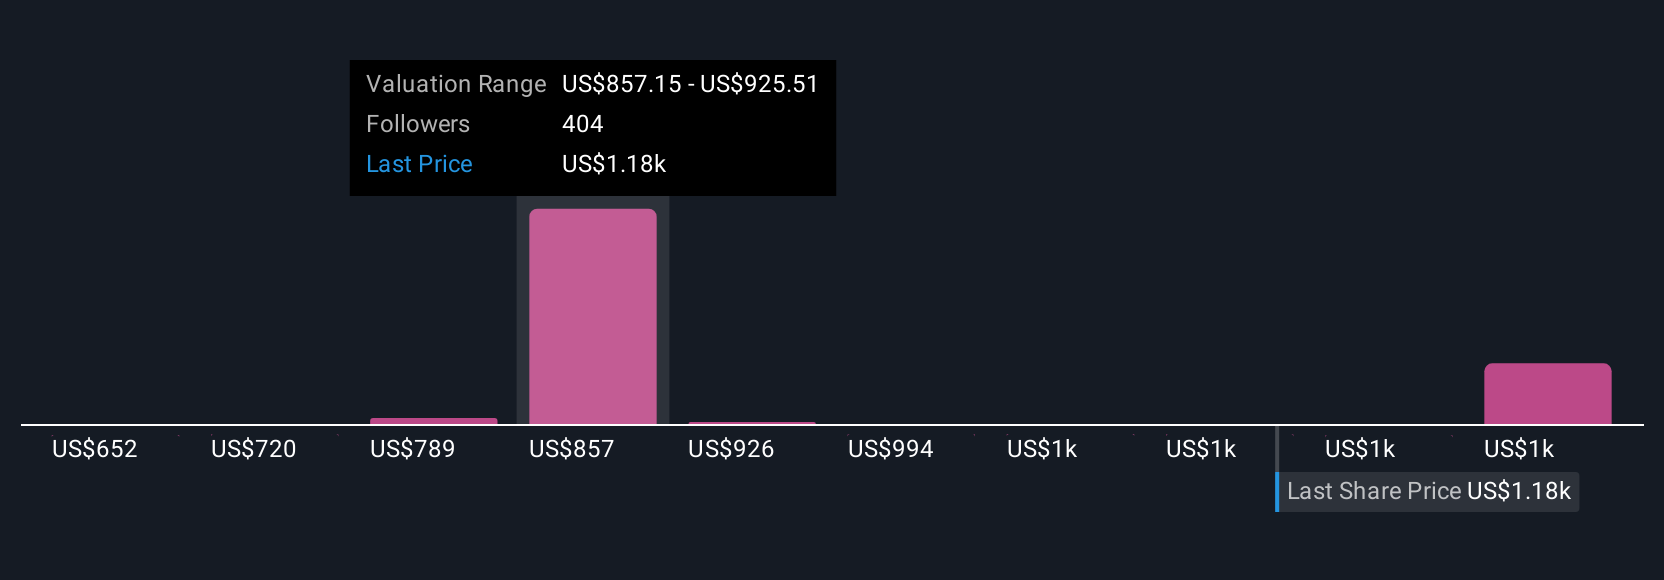
This tool helps you decide when to buy or sell by visually comparing the Fair Value of Netflix from your Narrative to the current Share Price. As new information emerges, from product launches to headline news or quarterly earnings, Narratives automatically update to reflect the latest data, ensuring your evaluation always stays relevant.
For example, some investors see Netflix as worth as much as $1,600 per share based on rapid growth in global ads and rising margins, while others forecast as low as $750 per share due to tougher competition and slowing subscriber growth. Your Narrative can reflect whichever viewpoint matches your outlook.
Do you think there's more to the story for Netflix? Head over to our Community to see what others are saying!
This article by Simply Wall St is general in nature. We provide commentary based on historical data and analyst forecasts only using an unbiased methodology and our articles are not intended to be financial advice. It does not constitute a recommendation to buy or sell any stock, and does not take account of your objectives, or your financial situation. We aim to bring you long-term focused analysis driven by fundamental data. Note that our analysis may not factor in the latest price-sensitive company announcements or qualitative material. Simply Wall St has no position in any stocks mentioned.
Have feedback on this article? Concerned about the content? Get in touch with us directly. Alternatively, email editorial-team@simplywallst.com