
Assessing Garmin’s Stock Value After a 23.8% Drop and Recent Product Launch Buzz
- Ever wondered if Garmin’s stock is actually a hidden gem or if its price tags are a bit rich for what you’re getting? Let’s cut through the noise and take a closer look.
- In the past month, Garmin shares have tumbled by 23.8% and are down 4.9% over the last week, shaking up investors’ views on the stock’s growth potential and risk.
- There has been plenty of buzz lately around Garmin’s product launches and industry partnerships, each adding fresh context to that recent drop. Analysts and headlines alike have been dissecting how these events might reshape Garmin’s competitive edge in the tech-lifestyle space.
- Currently, Garmin scores a 1 out of 6 on our quick undervaluation check. This number says a lot, but not everything. Read on as we explore classic ways to value Garmin’s stock and hint at an even smarter approach you’ll want to catch at the end.
Garmin scores just 1/6 on our valuation checks. See what other red flags we found in the full valuation breakdown.
Approach 1: Garmin Discounted Cash Flow (DCF) Analysis
The Discounted Cash Flow (DCF) model projects a company’s future cash flows and discounts them back to the present to estimate what the business is really worth today. This approach helps investors focus on how much cash Garmin is expected to generate in the future, not just today’s profits.
According to the latest data, Garmin’s current Free Cash Flow stands at $1.33 billion. Analyst estimates extend over the next five years, with projections reaching up to $2.05 billion by the end of 2029. Beyond that, longer-term growth is extrapolated based on established trends and analyst consensus. This model uses the 2 Stage Free Cash Flow to Equity method, which considers both near-term and long-term scenarios for a more comprehensive forecast. All figures are denominated in USD.
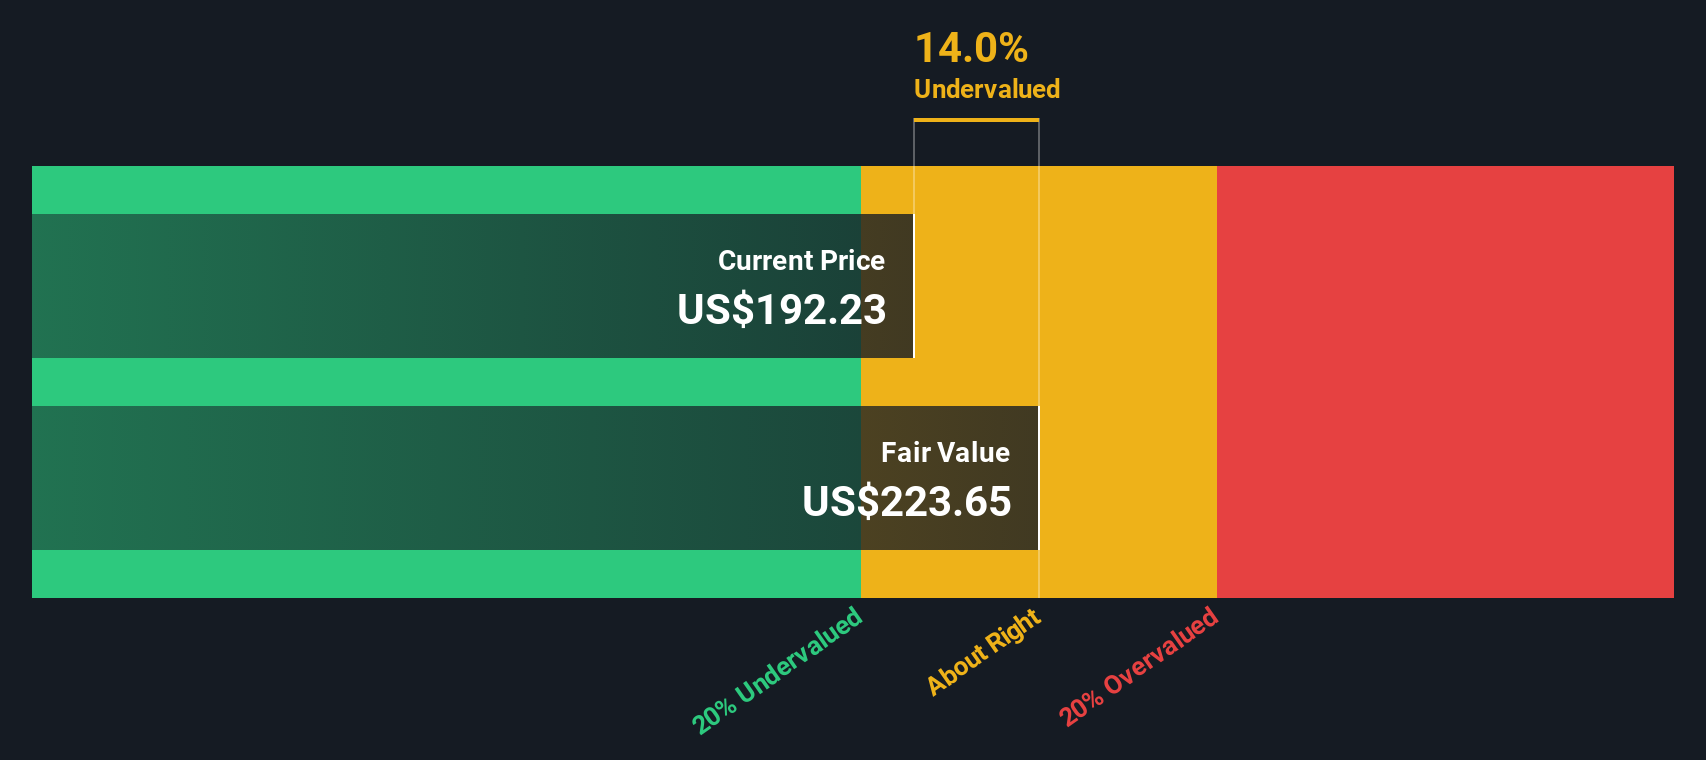
Based on these cash flow projections, Garmin’s intrinsic value is estimated at $223.68 per share. This is about 15.1% above where the stock trades today, which suggests it is currently undervalued according to the DCF model.
Result: UNDERVALUED
Our Discounted Cash Flow (DCF) analysis suggests Garmin is undervalued by 15.1%. Track this in your watchlist or portfolio, or discover 900 more undervalued stocks based on cash flows.
Approach 2: Garmin Price vs Earnings (P/E Multiple)
For a profitable company like Garmin, the Price-to-Earnings (P/E) ratio is a widely respected and intuitive way to assess valuation. This metric tells investors how much they are paying for each dollar of earnings, helping compare companies with similar business models or within the same industry.
What counts as a “fair” P/E depends on a mix of factors. Higher growth expectations, strong margins, or lower risk profiles can justify a richer P/E, while industries facing headwinds or higher risk see lower ratios. It is important to look beyond headline numbers and factor in each company’s unique circumstances.
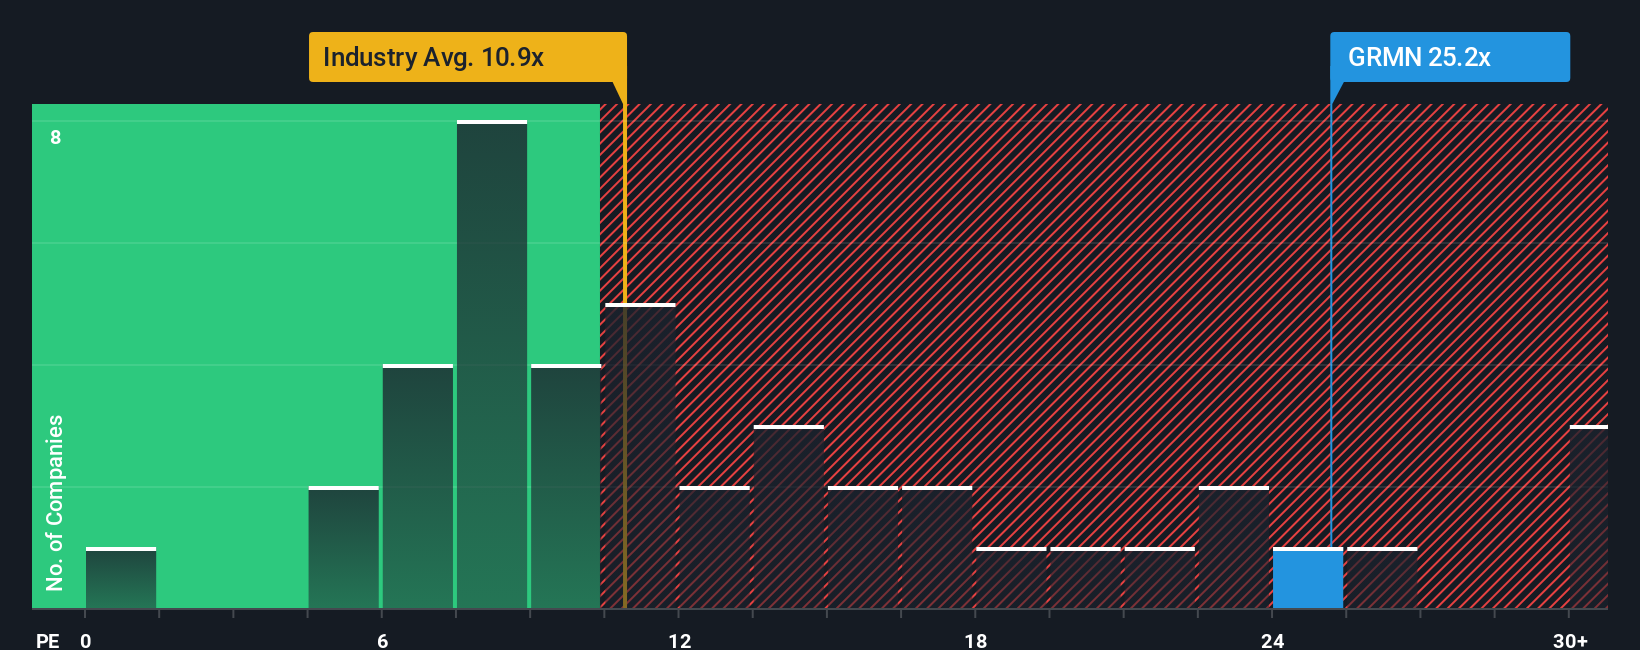
Right now, Garmin is trading at a P/E ratio of 23.2x, which is noticeably higher than the Consumer Durables industry average of 11.1x and above its peer group average of 21.7x. However, Simply Wall St’s proprietary Fair Ratio for Garmin, which accounts for growth outlook, margins, market cap, and risk, is 18.3x. Unlike simple peer or industry benchmarks, this Fair Ratio adapts to the nuances of Garmin’s actual prospects instead of only comparing against broad, sometimes irrelevant, averages.
Comparing Garmin’s current P/E of 23.2x to its Fair Ratio of 18.3x, the stock appears to be overvalued by this measure.
Result: OVERVALUED
PE ratios tell one story, but what if the real opportunity lies elsewhere? Discover 1412 companies where insiders are betting big on explosive growth.
Upgrade Your Decision Making: Choose your Garmin Narrative
Earlier we mentioned that there is an even better way to understand valuation, so let us introduce you to Narratives. A Narrative is your own story about a company; it is where you lay out your perspective behind the numbers, making your assumptions about Garmin’s future sales, earnings, and margins transparent and personalized.
Narratives make valuation personal and intuitive by connecting the story you believe about Garmin, the numbers you expect, and the Fair Value that follows. With Simply Wall St’s Narratives tool, available to millions of investors on the Community page, you can quickly build and update your Narrative as new news or earnings emerge. This way, your investment thesis always reflects the latest reality.
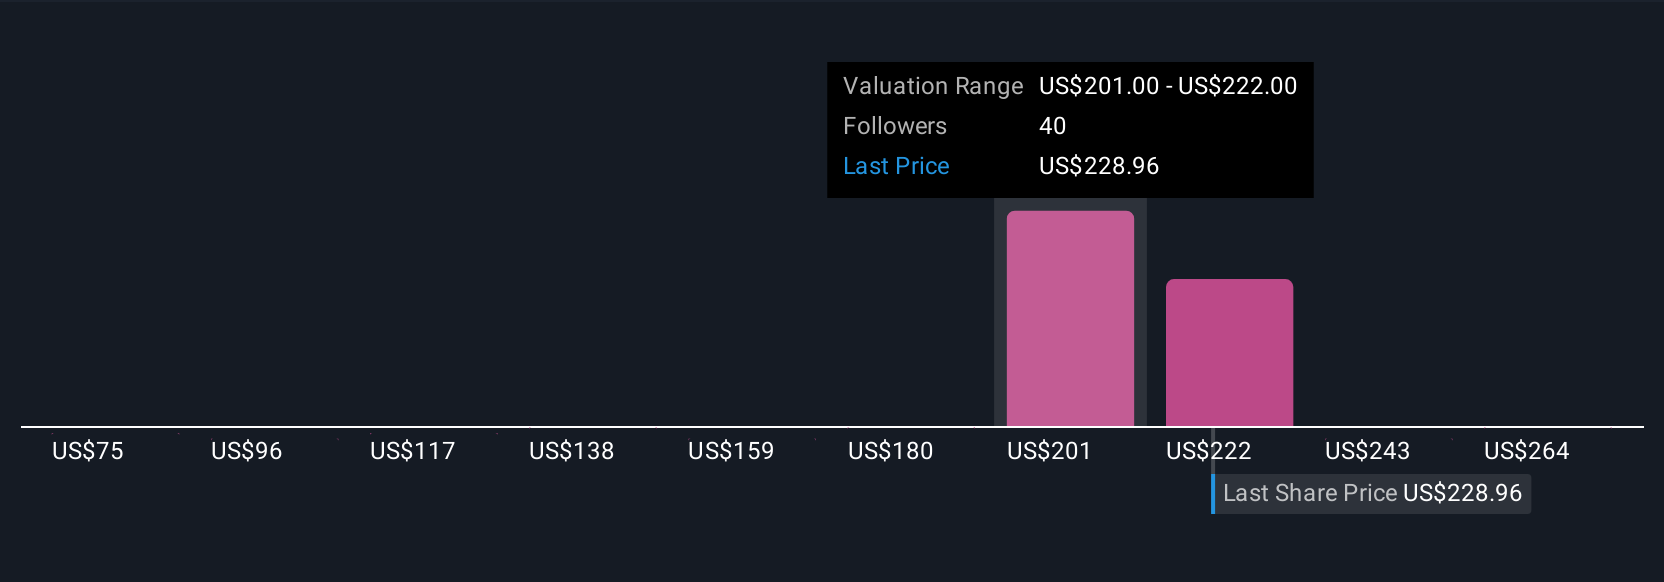
With Narratives, you can see at a glance whether your Fair Value is above or below the current stock price, helping you decide when to buy or sell with confidence. For example, some optimistic investors recently forecast Garmin could be worth up to $285 per share due to accelerating fitness and aviation momentum, while more cautious ones estimate Fair Value as low as $167 if margin and global headwinds weigh down future growth. Narratives let you capture these unique viewpoints, ground them in actual business drivers, and make better investment decisions, all in one place.
Do you think there's more to the story for Garmin? Head over to our Community to see what others are saying!
This article by Simply Wall St is general in nature. We provide commentary based on historical data and analyst forecasts only using an unbiased methodology and our articles are not intended to be financial advice. It does not constitute a recommendation to buy or sell any stock, and does not take account of your objectives, or your financial situation. We aim to bring you long-term focused analysis driven by fundamental data. Note that our analysis may not factor in the latest price-sensitive company announcements or qualitative material. Simply Wall St has no position in any stocks mentioned.
Have feedback on this article? Concerned about the content? Get in touch with us directly. Alternatively, email editorial-team@simplywallst.com