
Did Alibaba’s 85% Surge in 2025 Reflect Its True Value After Regulatory Easing?
- Curious if Alibaba Group Holding is still a smart buy after its huge run, or are you skeptical that it’s fully valued? Let’s dig into what the numbers and recent news are really telling us about where the stock stands today.
- Shares have rocketed up 85.7% year-to-date and 79.5% in the past year, but have slid by 4.9% over the last week and 5.6% over the past month. This highlights just how quickly sentiment can swing.
- Much of Alibaba’s recent price action stems from renewed optimism around Chinese tech stocks after regulatory uncertainty eased, along with news highlighting efforts to streamline operations and enhance shareholder value, such as its spinoff plans and buyback programs. Headlines about shifts in government policy and industry competition have also kept attention focused on this stock’s next big move.
- According to our valuation framework, Alibaba scores an impressive 6 out of 6 on undervaluation checks. We’ll walk through how this was calculated using multiple valuation approaches. Stick around, because at the end, we’ll share what might be an even more insightful way to put these scores in context.
Approach 1: Alibaba Group Holding Discounted Cash Flow (DCF) Analysis
The Discounted Cash Flow (DCF) model estimates a company's intrinsic value by projecting its future cash flows and then discounting those amounts back to today's value. This approach helps investors determine what a business is really worth based on its cash-generating abilities.
For Alibaba Group Holding, the current Free Cash Flow stands at approximately CN¥83.1 Billion. Analysts forecast continued growth, with Free Cash Flow anticipated to rise to about CN¥189.3 Billion in 2029. It is important to note that analyst estimates are generally available for up to five years, and projections beyond that are extrapolated using established methodologies.
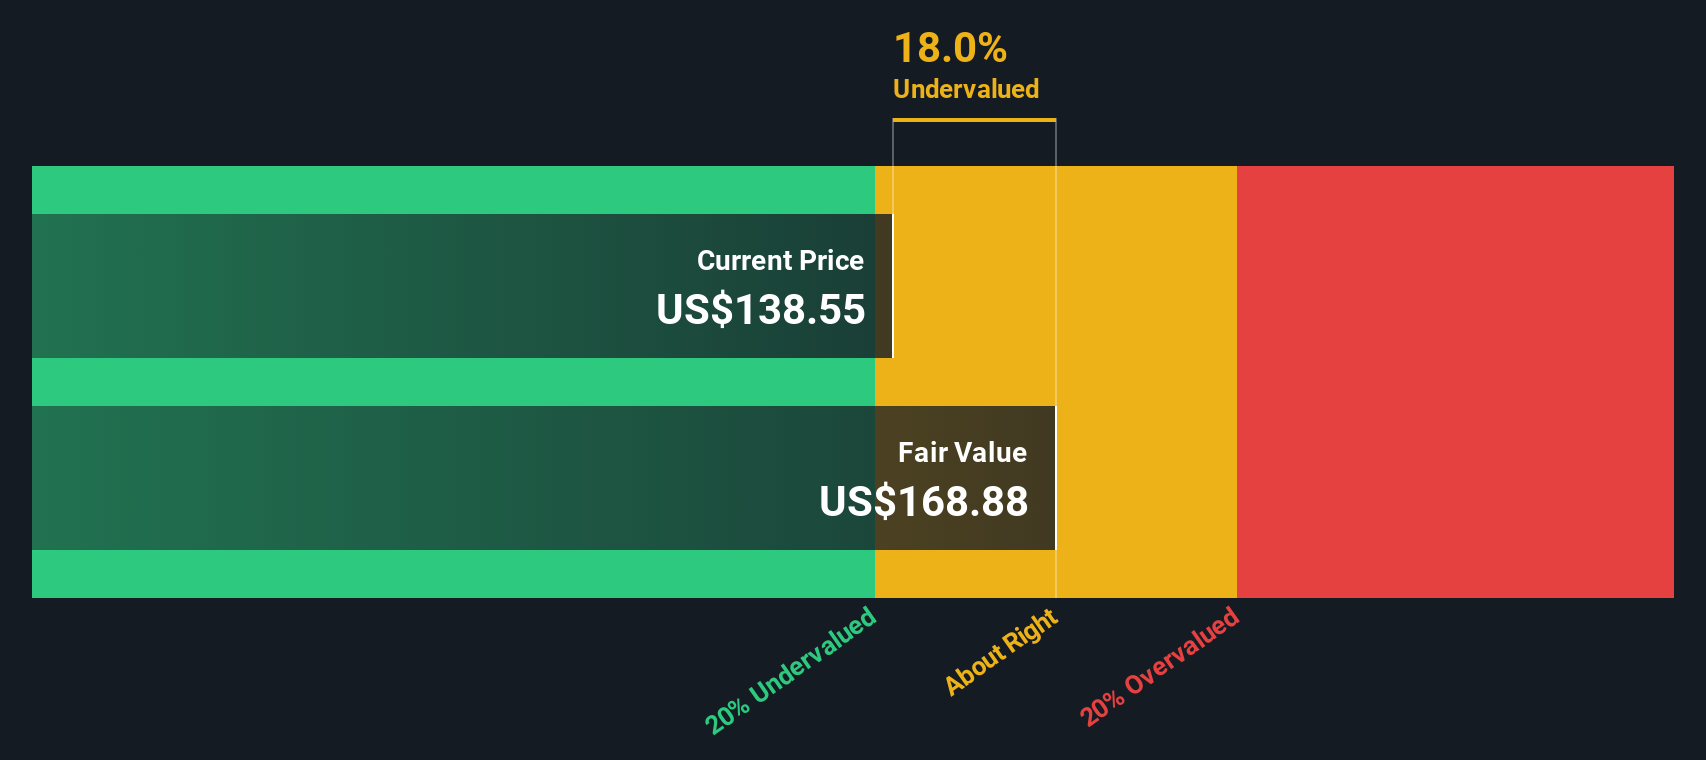
The DCF model applied here, specifically the 2 Stage Free Cash Flow to Equity approach, calculates a fair value per share of $260.48 in Alibaba's listing currency, which is roughly 39.5% above its recent market level. This suggests the stock is trading below what its future cash flow potential might indicate.
Result: UNDERVALUED
Our Discounted Cash Flow (DCF) analysis suggests Alibaba Group Holding is undervalued by 39.5%. Track this in your watchlist or portfolio, or discover 894 more undervalued stocks based on cash flows.
Approach 2: Alibaba Group Holding Price vs Earnings (PE)
For companies that generate consistent profits, the Price-to-Earnings (PE) multiple is a popular and effective way to assess value. The PE ratio tells investors how much they are paying for each dollar of earnings. This makes it especially useful for measuring whether a stock is cheap or expensive relative to its profits.
Growth expectations and perceived risks play a key role in determining what a fair PE ratio should be. Companies with higher growth prospects and lower risks typically warrant higher PE ratios, while slower-growing or riskier firms command lower multiples.
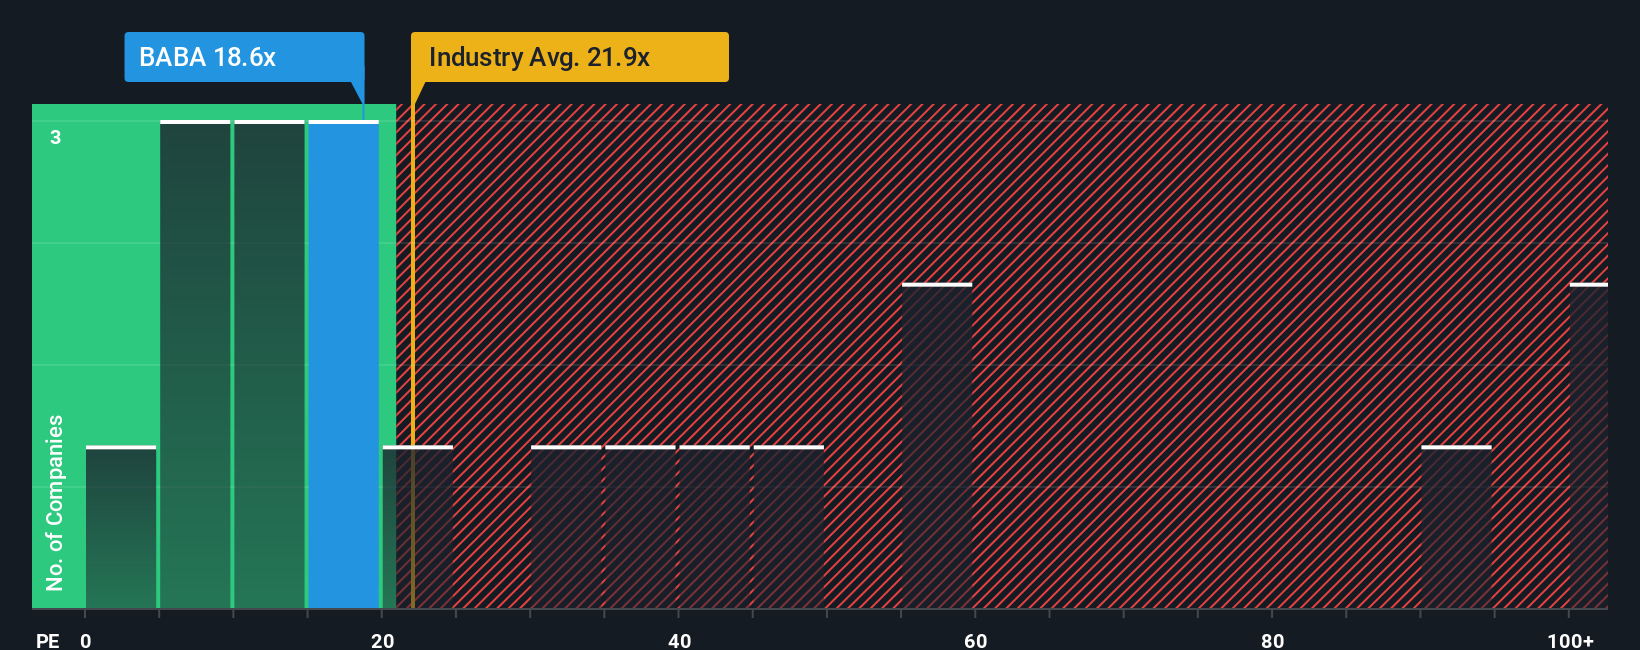
Alibaba’s current PE ratio sits at 16.9x. This compares favorably with the industry average of 19.5x and is well below the peer average of 39.2x. At first glance, this suggests Alibaba trades at an attractive discount both to its industry and to comparable companies.
To get a more nuanced perspective, Simply Wall St calculates a company-specific “Fair Ratio.” Unlike simple benchmarks, the Fair Ratio incorporates factors such as Alibaba’s earnings growth, profit margins, market capitalization, risk profile, and its industry positioning. This produces a valuation that is tailored to the company rather than relying solely on broad averages, and offers a more meaningful basis for comparison.
Alibaba’s Fair Ratio is 27.2x, significantly higher than its current PE of 16.9x. This gap indicates Alibaba is undervalued compared to what a fair valuation would suggest based on its unique financials and outlook.
Result: UNDERVALUED
PE ratios tell one story, but what if the real opportunity lies elsewhere? Discover 1421 companies where insiders are betting big on explosive growth.
Upgrade Your Decision Making: Choose your Alibaba Group Holding Narrative
Earlier we mentioned that there’s an even better way to understand valuation, so let’s introduce you to Narratives. A Narrative is simply your personalized story about a company, your perspective that connects financial forecasts (like revenue growth, profit margins and fair value estimates) with the real-world events and trends shaping its future. Narratives not only let you explain why you believe a stock is a buy or sell, but they link your view directly to financial outcomes, helping you see how the company’s story could play out in the numbers.
On Simply Wall St, millions of investors are already sharing their Narratives on the Community page, making it easy for anyone to create or follow investment stories grounded in data and updated automatically when new information (such as news or earnings) arrives. Narratives help you compare your estimated Fair Value to the current Price, so you can more confidently decide if the time is right to buy, hold, or sell.
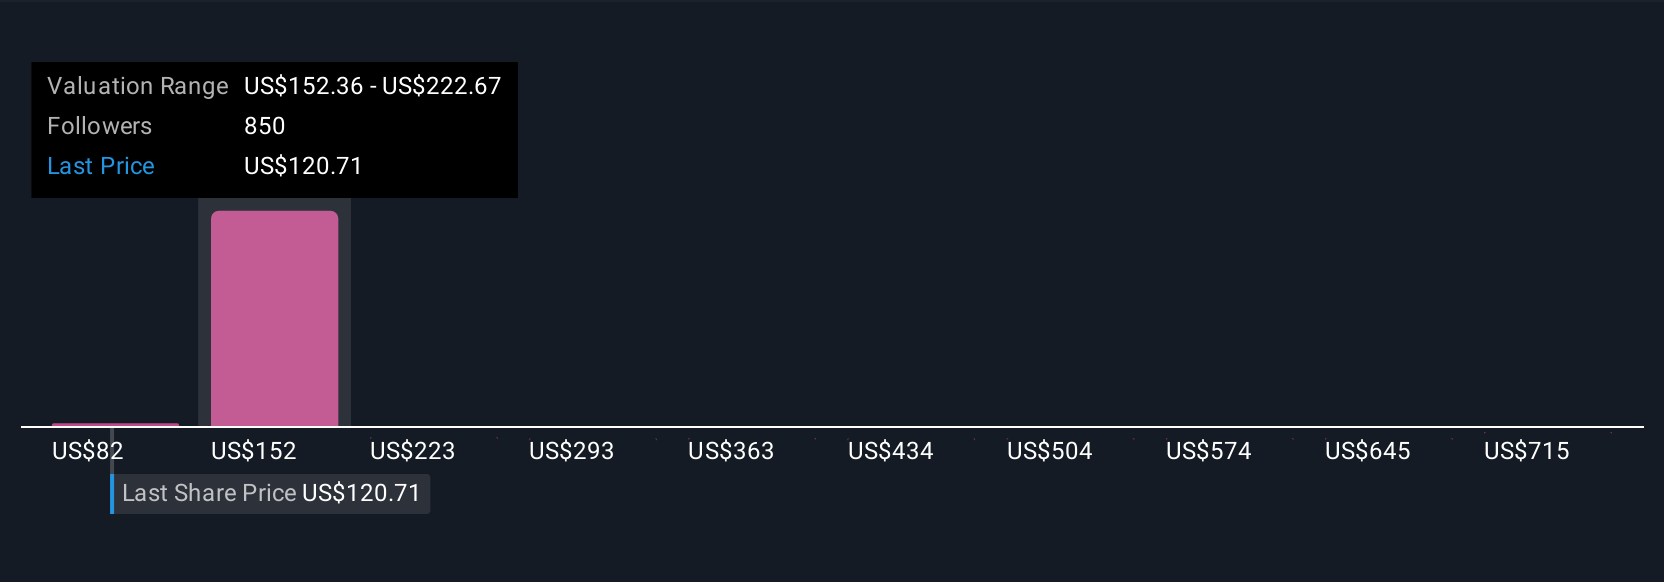
As an example, some investors see Alibaba’s AI and cloud investments leading to strong earnings and price targets as high as $196.82 per share, while others focus on margin pressures and risks, setting targets closer to $107.09. This highlights how different Narratives, backed by data, can shape different investment decisions.
For Alibaba Group Holding, we make it easy for you with previews of two leading Alibaba Group Holding Narratives:
- 🐂 Alibaba Group Holding Bull Case
Fair Value Estimate: $196.82
Current price is 19.8% below narrative fair value
Projected annual revenue growth: 8.81%
- Heavy investments in AI, cloud, and quick commerce are expected to drive long-term revenue and margin growth, despite near-term profit pressure.
- Enhanced partnerships and integration are strengthening Alibaba’s enterprise position and expanding its ecosystem, which should increase user engagement and monetization.
- Cautiously, analysts highlight that sustained spending and intensified competition could prolong margin pressure, but the consensus sees upside potential as these strategies mature.
- 🐻 Alibaba Group Holding Bear Case
Fair Value Estimate: $107.09
Current price is 47.3% above narrative fair value
Projected annual revenue growth: 14.12%
- While operational momentum in AI, cloud, and core e-commerce is strong, the stock is seen as overvalued by 14.6% due to macro headwinds and ongoing regulatory and geopolitical risk.
- Key risks are US-China trade tensions, increased regulation, tough competition in cloud and AI sectors, and exposure to currency fluctuations.
- Analyst notes strong free cash flow, a dominant e-commerce position, and reasonable multiples; yet flags that the recent rally may already have priced in much of the near-term growth.
Do you think there's more to the story for Alibaba Group Holding? Head over to our Community to see what others are saying!
This article by Simply Wall St is general in nature. We provide commentary based on historical data and analyst forecasts only using an unbiased methodology and our articles are not intended to be financial advice. It does not constitute a recommendation to buy or sell any stock, and does not take account of your objectives, or your financial situation. We aim to bring you long-term focused analysis driven by fundamental data. Note that our analysis may not factor in the latest price-sensitive company announcements or qualitative material. Simply Wall St has no position in any stocks mentioned.
Have feedback on this article? Concerned about the content? Get in touch with us directly. Alternatively, email editorial-team@simplywallst.com