
Is Nasdaq’s Fintech Expansion Justifying Its Premium Price in 2025?
- Wondering if Nasdaq stock is priced for greatness or if the market's already caught on? You're not alone. Today we're digging right into what makes its valuation tick.
- While the stock has climbed an impressive 122.1% over five years, recent returns have cooled, with a slight -0.8% move this past week and a -1.7% drop over the last month.
- Recent headlines have focused on Nasdaq's expansion into new fintech partnerships and innovative trading solutions, signaling that its growth story may be entering a new phase. These updates have added fuel for both bulls and skeptics, making market watchers question what the right price for Nasdaq really is right now.
- On the valuation front, Nasdaq currently earns a 1 out of 6 on our value checklist, suggesting the market isn't finding loads of undervalued signals just yet. We'll break down the standard valuation methods in a moment, but stick around because there's a much smarter approach to understanding this stock coming at the end of the article.
Nasdaq scores just 1/6 on our valuation checks. See what other red flags we found in the full valuation breakdown.
Approach 1: Nasdaq Excess Returns Analysis
The Excess Returns Model assesses whether a company is generating returns above the cost of its capital. In other words, it asks if each new dollar invested is truly adding value for shareholders. For Nasdaq, this model uses analyst consensus and projections for key financial measures to estimate the company’s strength in turning equity into profits.
Currently, Nasdaq's Book Value per share stands at $20.99, with an expected stable Book Value of $22.42, as projected by analysts. The company’s average Return on Equity (ROE) is an impressive 17.60%, with stable earnings per share forecasted at $3.95 (derived from five analyst estimates). With a Cost of Equity at $1.92 per share, Nasdaq's Excess Return, meaning the profit produced over and above what investors require, comes to $2.02 per share.
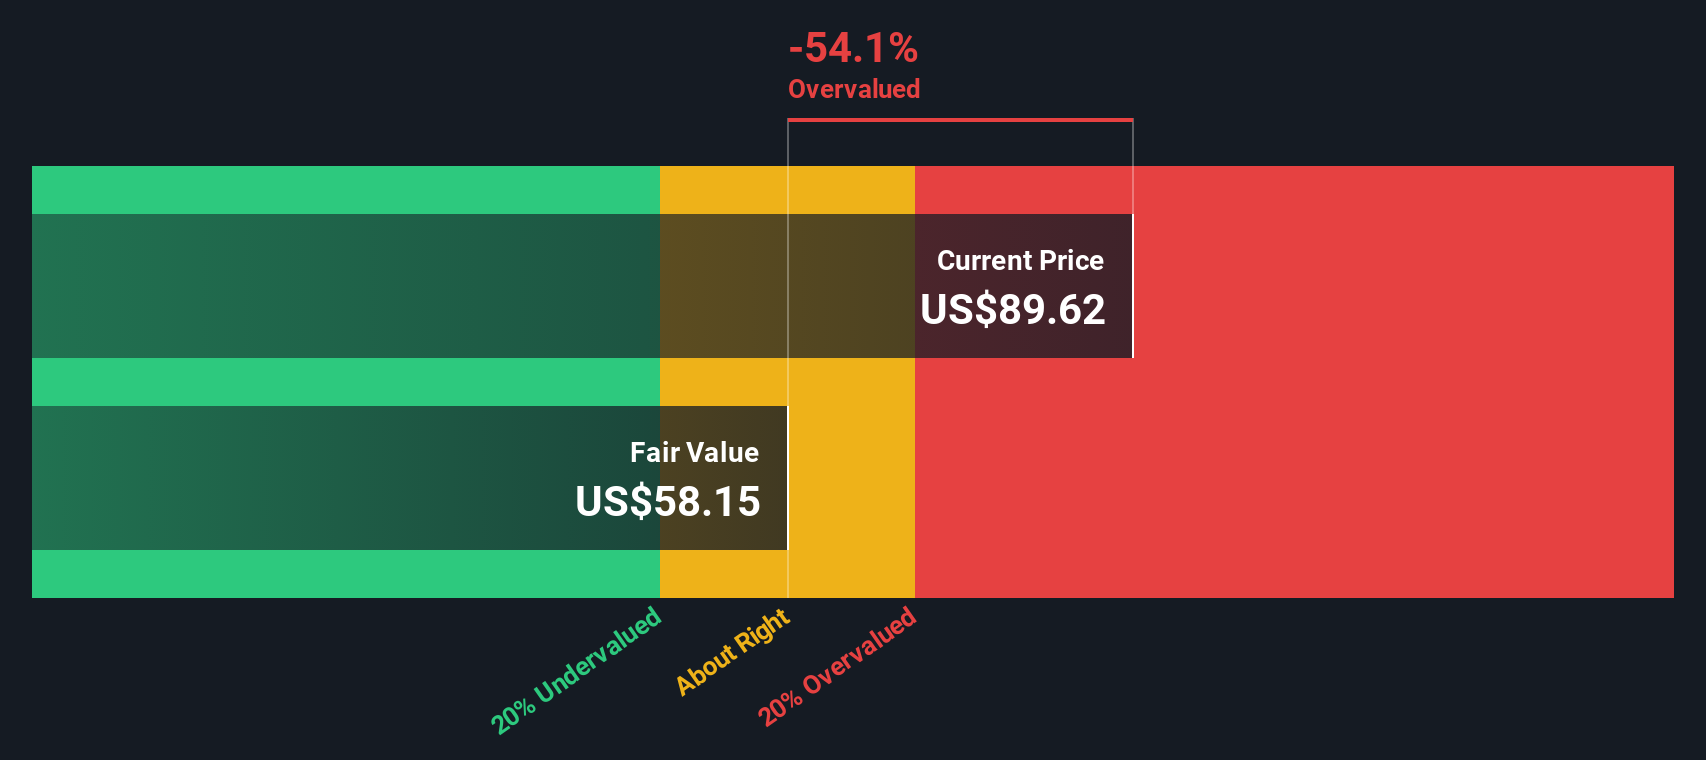
Despite these robust figures, the Excess Returns Model calculates an estimated intrinsic value that suggests Nasdaq shares are currently 44.2% overvalued compared to their fair price. This outcome indicates investors may be paying a premium for Nasdaq’s future growth and profitability at the moment.
Result: OVERVALUED
Our Excess Returns analysis suggests Nasdaq may be overvalued by 44.2%. Discover 905 undervalued stocks or create your own screener to find better value opportunities.
Approach 2: Nasdaq Price vs Earnings
The Price-to-Earnings (PE) ratio is a favorite valuation tool for profitable companies like Nasdaq, as it directly compares the stock price to the company’s bottom-line earnings. This makes it a helpful lens for investors, especially when the business is consistently generating profits as Nasdaq is.
The “right” PE ratio depends on several factors. Higher growth expectations or lower risk profiles can justify pricier valuations, meaning investors are willing to pay more for each dollar of current earnings if they foresee strong, steady growth in the future. Conversely, slower growth or higher risks typically warrant a lower PE.
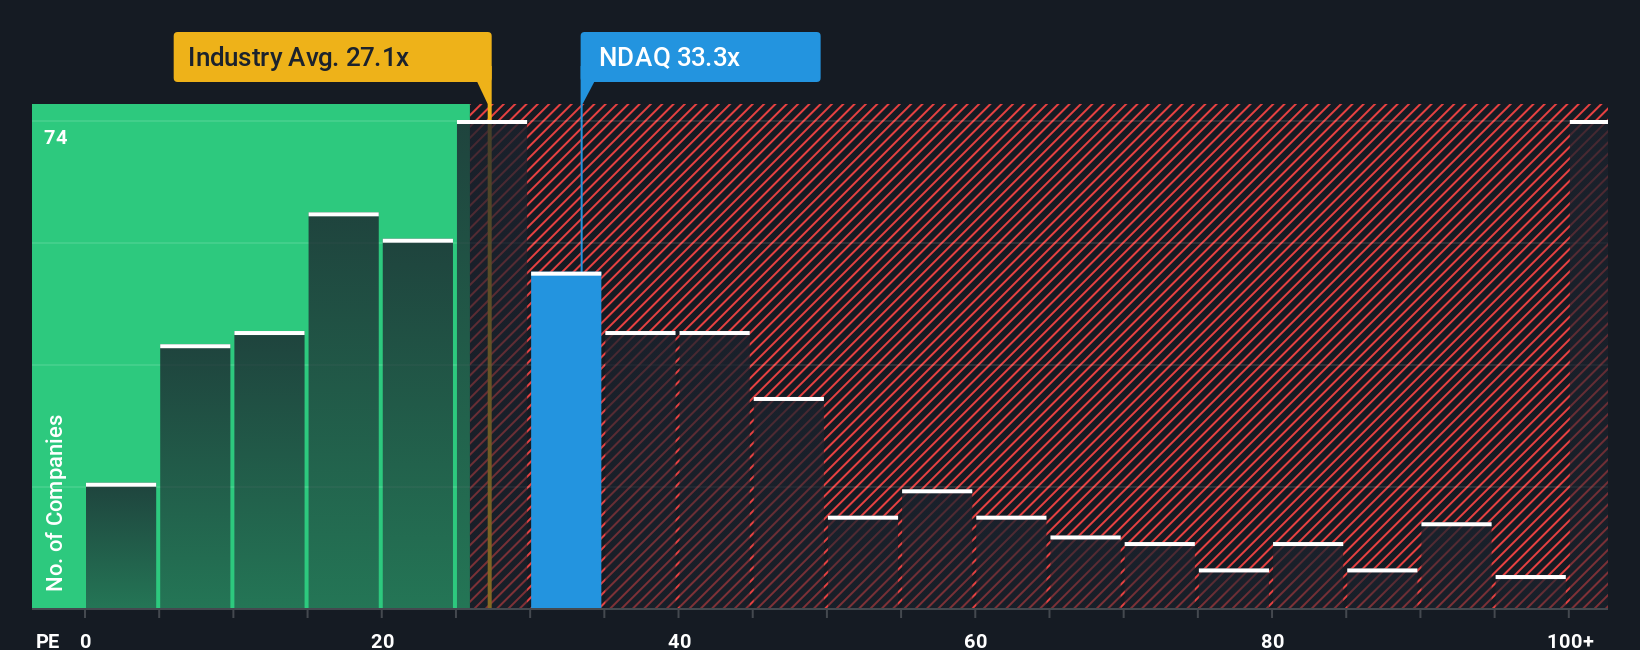
Nasdaq's current PE sits at 30.6x, marginally below the average of its peers at 32x, but notably above the broader industry average of 24.9x. While these benchmarks offer useful context, they do not tell the whole story. That is where Simply Wall St’s "Fair Ratio" comes in, a proprietary metric that blends factors like Nasdaq’s projected earnings growth, profitability, risk level, industry norms, and market cap to arrive at a personalized fair value multiple. In this case, Nasdaq’s Fair Ratio is 16.0x, substantially lower than its current PE.
The Fair Ratio is a smarter comparison point than peers or industry averages alone, since it adjusts for Nasdaq’s unique prospects and risks. Comparing this Fair Ratio of 16.0x to the actual PE of 30.6x, it is clear the stock is trading at a significant premium to its fair value based on fundamentals.
Result: OVERVALUED
PE ratios tell one story, but what if the real opportunity lies elsewhere? Discover 1416 companies where insiders are betting big on explosive growth.
Upgrade Your Decision Making: Choose your Nasdaq Narrative
Earlier we mentioned there is an even better way to understand valuation, so let's introduce you to Narratives. A Narrative is your personalized story about a company. It allows you to attach your own perspective to the numbers by making assumptions about fair value, future revenue, earnings, and profit margins. Narratives connect what you believe about a business with a dynamic financial forecast and a fair value calculation, turning abstract data into a clear investment thesis.
On Simply Wall St’s Community page, Narratives are a powerful, easy-to-use tool (trusted by millions of investors) that help you track and compare your fair value against the latest share price, so you can confidently decide when to buy or sell. As news or earnings are released, Narratives update automatically, keeping your outlook relevant. For example, some investors might use bullish assumptions for Nasdaq and arrive at a fair value well above $110 per share, believing product innovation and global expansion will drive profit margins and growth far higher. Others may take a more conservative approach, forecasting challenges for Nasdaq and seeing fair value closer to $74, guided by cautious revenue projections and competitive risks. Narratives make it easy to visualize these differences, helping you invest with conviction and insight.
Do you think there's more to the story for Nasdaq? Head over to our Community to see what others are saying!

This article by Simply Wall St is general in nature. We provide commentary based on historical data and analyst forecasts only using an unbiased methodology and our articles are not intended to be financial advice. It does not constitute a recommendation to buy or sell any stock, and does not take account of your objectives, or your financial situation. We aim to bring you long-term focused analysis driven by fundamental data. Note that our analysis may not factor in the latest price-sensitive company announcements or qualitative material. Simply Wall St has no position in any stocks mentioned.
Have feedback on this article? Concerned about the content? Get in touch with us directly. Alternatively, email editorial-team@simplywallst.com