
Is OMRON’s Share Price Justified After 24% Drop and Tech Sector Shifts in 2025?
- Curious about whether OMRON is undervalued or primed for a comeback? You're not alone, and figuring out the real story behind the stock is key to making smart investment moves.
- OMRON shares have moved up 1.5% over the last week, but are still down 7.2% for the month and have dropped 24.0% year-to-date. This reflects some ongoing volatility and a changing market outlook.
- Recent headlines have drawn attention to shifts in the global tech sector and evolving demand for automation equipment, both of which impact OMRON's positioning. Investors are watching closely as the industry adapts to new challenges and opportunities in areas like robotics and factory automation.
- Currently, OMRON scores just 0 out of 6 on our undervaluation checks, meaning it doesn't tick any of the standard value boxes. However, that's only part of the story. Let's dig into the methods behind this score and, at the end, introduce a more holistic way to assess the stock's real value.
OMRON scores just 0/6 on our valuation checks. See what other red flags we found in the full valuation breakdown.
Approach 1: OMRON Discounted Cash Flow (DCF) Analysis
The Discounted Cash Flow (DCF) model is widely used to estimate a company's intrinsic value by projecting future free cash flows and discounting them back to present value. This approach helps investors assess whether a stock is priced attractively compared to its fundamental outlook.
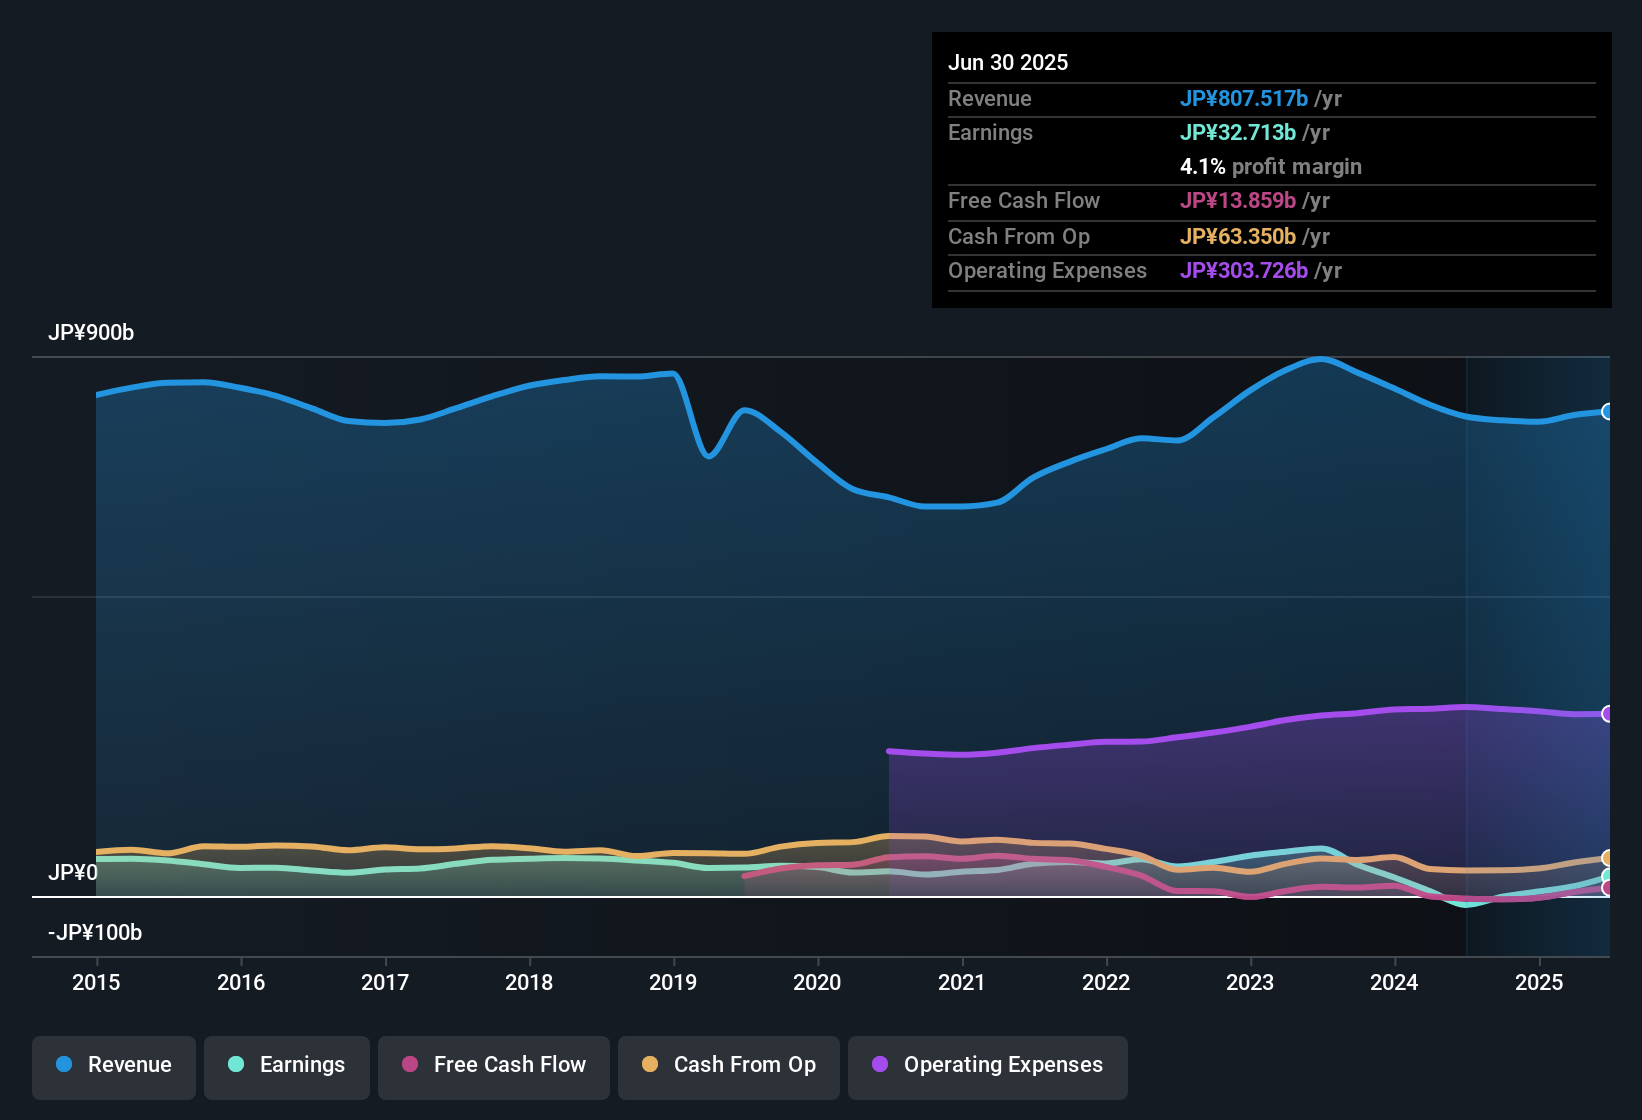
For OMRON, the analysis begins with last year's Free Cash Flow, which totaled approximately ¥12.16 billion. Analysts forecast rapid growth in the coming years, with projections climbing to ¥40.86 billion by the fiscal year ending March 2030. Notably, forecasts are most reliable through 2028. After 2028, estimates transition to extrapolations based on recent trends and analyst assumptions.
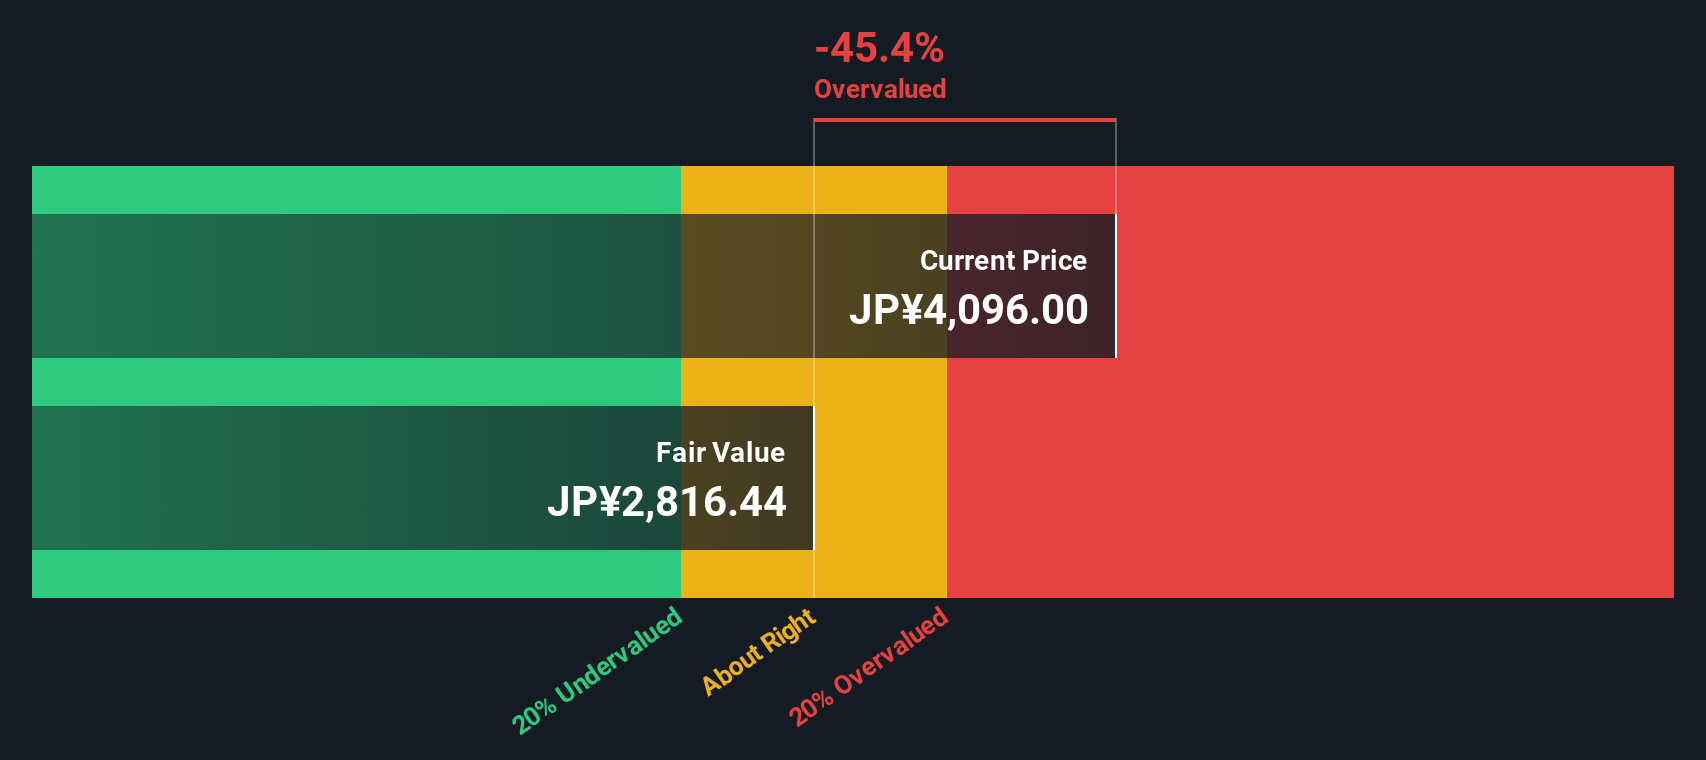
Using these projections, the DCF model arrives at an intrinsic value for OMRON shares of ¥2,776.48 each. However, this figure is 41.2% lower than the current share price, implying that the stock is significantly overvalued at today’s levels.
While cash flow growth prospects are promising, the DCF suggests investors are currently paying a substantial premium for these expectations.
Result: OVERVALUED
Our Discounted Cash Flow (DCF) analysis suggests OMRON may be overvalued by 41.2%. Discover 906 undervalued stocks or create your own screener to find better value opportunities.
Approach 2: OMRON Price vs Earnings
The Price-to-Earnings (PE) ratio is widely used for valuing profitable companies like OMRON because it connects a company’s share price directly to its actual earnings. This gives investors a quick sense of how much they are paying for each yen of profit generated. It works especially well when a company posts consistent profits and operates in a mature industry.
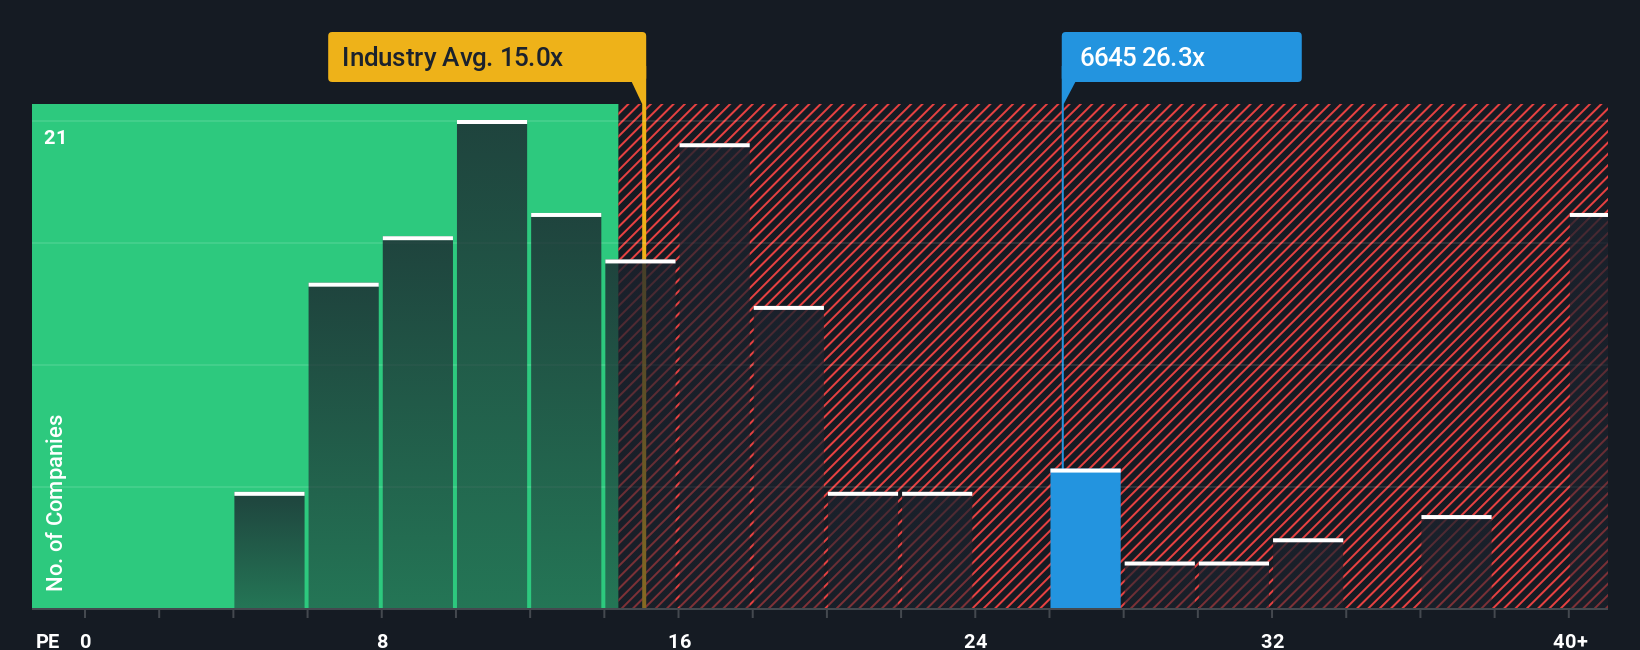
What makes a “fair” PE ratio can vary. Fast-growing or lower-risk companies often deserve higher multiples, while those with stagnant growth or greater risks may warrant lower ones. For OMRON, the current PE ratio stands at 26.9x, which is slightly above the peer group average of 26.6x and significantly higher than the electronic industry average of 14.7x. This suggests investors are willing to pay a premium, possibly in recognition of OMRON’s growth prospects, stability, or competitive position.
Simply Wall St’s proprietary “Fair Ratio” for OMRON is 23.6x. This figure goes further than basic peer or industry comparisons, as it is tailored to OMRON by factoring in expected earnings growth, risks, profit margins, market cap, and how the company compares within its sector. In essence, it gives a more holistic benchmark for what OMRON’s valuation should be.
Comparing the fair ratio of 23.6x with OMRON’s actual PE of 26.9x, the stock looks to be trading at a premium. The difference is more than 0.10, suggesting the shares are likely overvalued on the basis of forward earnings.
Result: OVERVALUED
PE ratios tell one story, but what if the real opportunity lies elsewhere? Discover 1413 companies where insiders are betting big on explosive growth.
Upgrade Your Decision Making: Choose your OMRON Narrative
Earlier we mentioned that there's an even better way to understand valuation, so let's introduce you to Narratives. A Narrative is a tool that lets you tell the story behind your numbers—your view on a company's outlook, its assumed fair value, and estimates for future revenue, earnings, or margins. Narratives bridge the gap between a company’s story, a financial forecast, and ultimately, a fair value, making your investment thesis much more concrete and actionable.
On Simply Wall St's Community page, Narratives are accessible and easy for anyone to use. Millions of investors already contribute their perspectives there. By comparing your Narrative's Fair Value to the current share price, you can quickly decide if OMRON is a buy, hold, or sell for you personally. As fresh news or quarterly results arrive, Narratives update in real time, keeping your view relevant and grounded in the latest information.
For example, one investor might build a Narrative for OMRON with a high Fair Value estimate of ¥3,500 per share based on optimism for automation growth, while another might set it as low as ¥2,100, reflecting more conservative expectations. This demonstrates how personalized insights can shape smarter investment decisions.
Do you think there's more to the story for OMRON? Head over to our Community to see what others are saying!
This article by Simply Wall St is general in nature. We provide commentary based on historical data and analyst forecasts only using an unbiased methodology and our articles are not intended to be financial advice. It does not constitute a recommendation to buy or sell any stock, and does not take account of your objectives, or your financial situation. We aim to bring you long-term focused analysis driven by fundamental data. Note that our analysis may not factor in the latest price-sensitive company announcements or qualitative material. Simply Wall St has no position in any stocks mentioned.
Have feedback on this article? Concerned about the content? Get in touch with us directly. Alternatively, email editorial-team@simplywallst.com