
Assessing NIO’s Valuation After Recent 8.2% Weekly Drop and Policy Headlines
- Wondering if NIO is fairly priced or if there is hidden value under the hood? You are not alone. Taking a closer look at the numbers can reveal solid clues for investors on the lookout for opportunity.
- The stock has soared this year, up 35.4% year-to-date and 31.9% over the past 12 months. However, it faced some sharp pullbacks, including an 8.2% dip in the past week.
- Much of this recent volatility has been fueled by headlines about shifting electric vehicle demand and ongoing policy changes in the Chinese auto sector. For instance, recent reports on government incentives for green vehicles and evolving competition from domestic rivals have both buoyed optimism and heightened uncertainty for shareholders.
- On pure valuation checks, NIO scores a 2 out of 6 according to our latest metrics here. Classic metrics are only part of the story. At the end of this analysis, we will reveal a smarter, forward-looking way to judge NIO's fair value.
NIO scores just 2/6 on our valuation checks. See what other red flags we found in the full valuation breakdown.
Approach 1: NIO Discounted Cash Flow (DCF) Analysis
The Discounted Cash Flow (DCF) model estimates a company's worth by projecting its future cash flows and discounting them back to today's value. This approach helps investors gauge what a business might be worth based on the cash it can generate over time.
NIO's latest reported Free Cash Flow (FCF) is a negative CN¥20.2 Billion, meaning that the company is currently burning through more cash than it brings in. However, projections show the tide could turn; analysts expect NIO's FCF to gradually recover, with Simply Wall St extrapolating an improvement to CN¥21.2 Billion by 2035. For example, in five years (2029), forecast models anticipate FCF of CN¥8.3 Billion, indicating significant improvement from current levels.
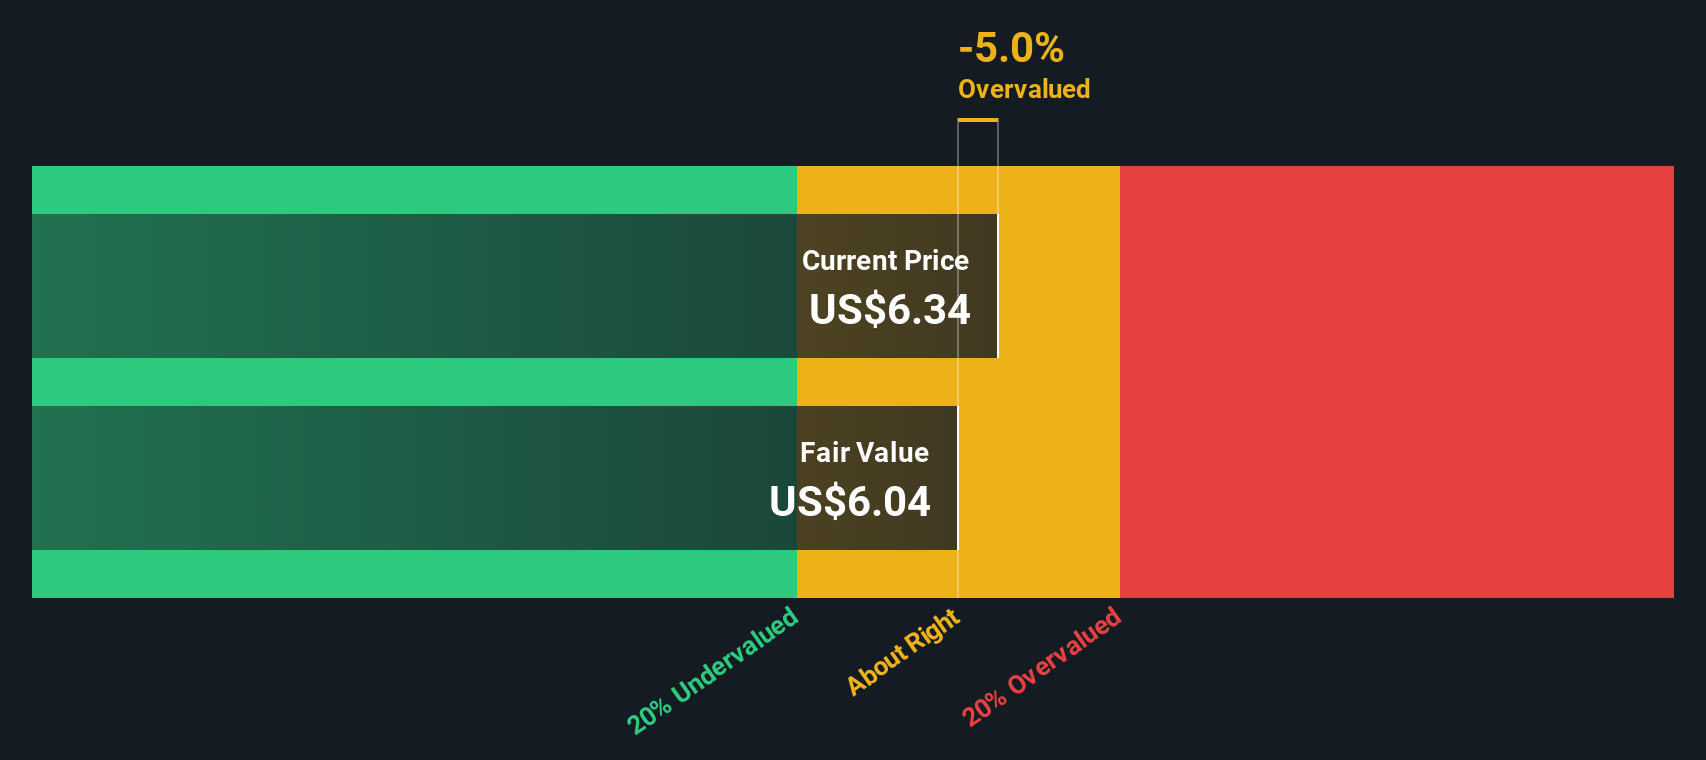
Taking these long-term cash flow forecasts into account, the DCF model arrives at an estimated intrinsic value of $6.88 per share for NIO. Compared to today's share price, this result signals that NIO stock is trading at a roughly 10.4% discount, which could indicate potential undervaluation.
Result: UNDERVALUED
Our Discounted Cash Flow (DCF) analysis suggests NIO is undervalued by 10.4%. Track this in your watchlist or portfolio, or discover 905 more undervalued stocks based on cash flows.
Approach 2: NIO Price vs Sales (P/S) Ratio
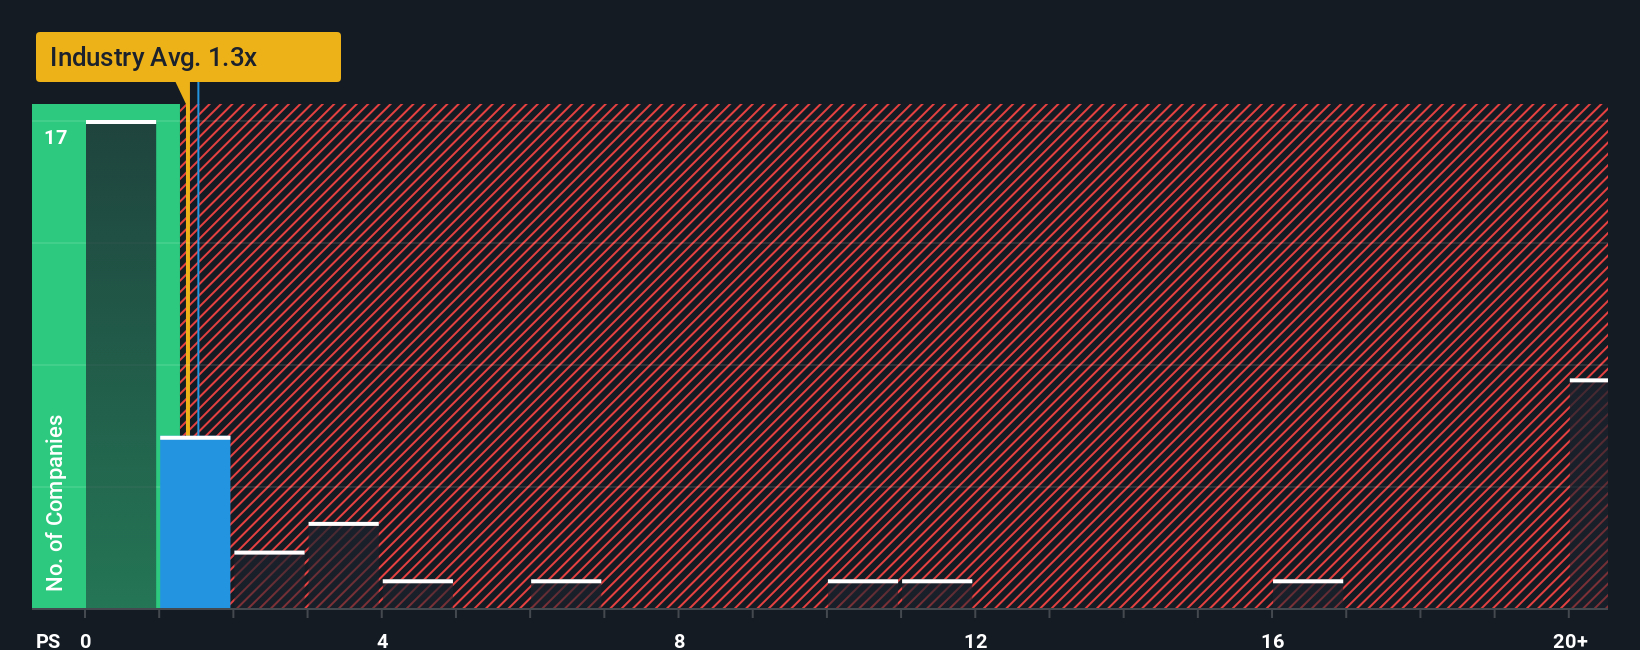
The Price-to-Sales (P/S) ratio is a useful valuation tool for companies such as NIO that are not currently profitable but still generate significant sales revenue. Unlike the Price-to-Earnings metric, which requires positive earnings, the P/S ratio offers a way to evaluate value based on top-line performance. This makes it especially relevant for early-growth or turnaround companies like NIO.
Generally, higher growth expectations and lower perceived risks can justify a higher P/S ratio, while slower growth or greater uncertainty might warrant a lower multiple. Investors look to the industry average and peers for comparison. At the moment, NIO trades at a P/S ratio of 1.56x. For reference, the average for the Auto industry is 0.99x, and NIO’s peers on average trade at 2.82x, highlighting a broad range of valuations within the sector.
Simply Wall St’s “Fair Ratio” adds another layer of insight. It provides a custom benchmark, in this case 1.40x, reflecting NIO’s individual characteristics such as expected revenue growth, profit margin outlook, risks, and company size. This proprietary metric offers a more nuanced view than simply comparing NIO to peers or the industry, as it is customized to the company’s evolving profile.
Comparing NIO’s current P/S ratio of 1.56x to its Fair Ratio of 1.40x suggests the stock is valued slightly above what would be expected, but the difference is minimal. Since this gap is less than 0.10, NIO looks about right in terms of valuation by this method.
Result: ABOUT RIGHT
PS ratios tell one story, but what if the real opportunity lies elsewhere? Discover 1411 companies where insiders are betting big on explosive growth.
Upgrade Your Decision Making: Choose your NIO Narrative
Earlier we mentioned that there is an even better way to understand valuation, so let’s introduce you to Narratives. A Narrative is more than just a number. It is the unique story or viewpoint you have about NIO that connects its business strategy, future growth, and risks to your own financial forecast and fair value estimate. By framing your investment thesis as a Narrative, you can clearly lay out your assumptions for future revenue, earnings, and profit margins, then compare your calculated fair value to the latest share price.
Narratives are available and easy to use right on Simply Wall St’s Community page, where millions of investors share, discuss, and refine their perspectives as new news or results arrive. Because Narratives update dynamically with every earnings release or market event, you are always working with the latest data and insights. This turns investing from a static spreadsheet into an interactive, flexible tool, helping you decide when it is time to buy, hold, or sell based on your conviction and the current market price.
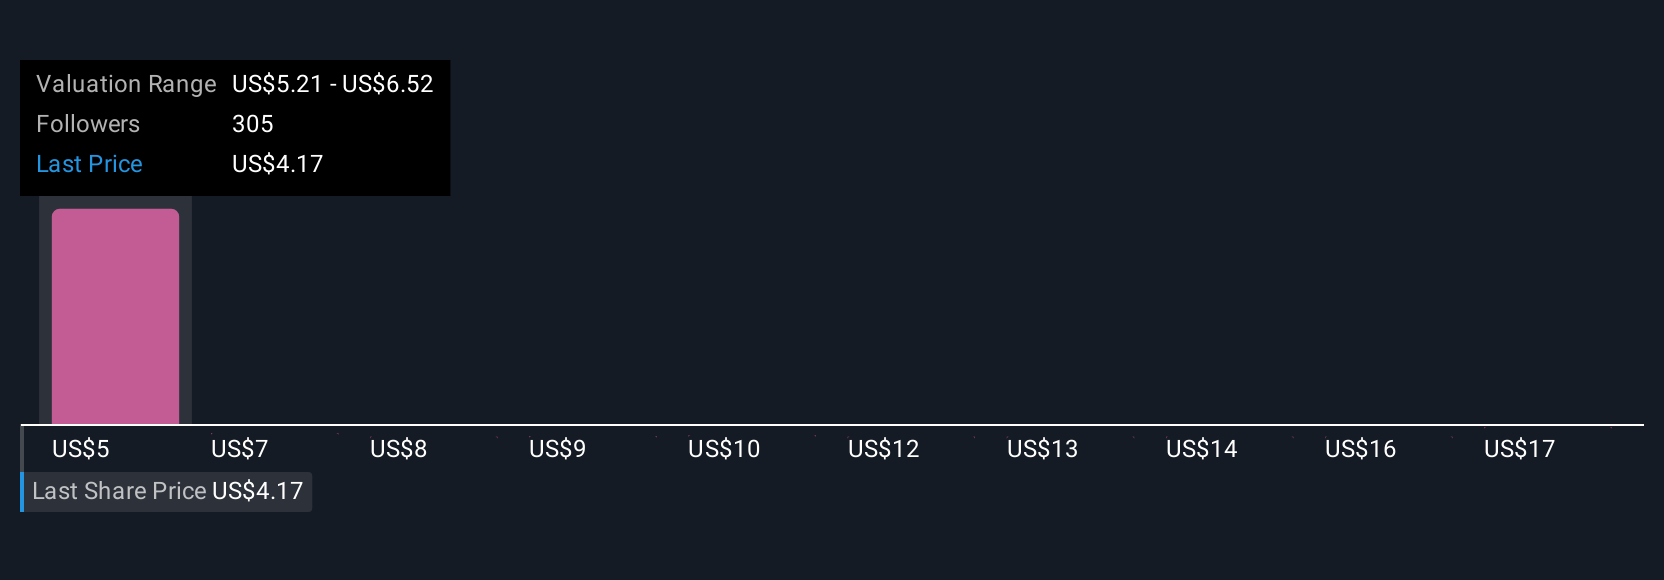
For example, if you expect NIO’s rapid global expansion to lift its value to analyst highs around $9.00, you might see big upside ahead. If, however, you’re more cautious and set your fair value near $3.00, recent rallies may look overdone. Narratives make it easy to see and compare both stories in real time.
Do you think there's more to the story for NIO? Head over to our Community to see what others are saying!
This article by Simply Wall St is general in nature. We provide commentary based on historical data and analyst forecasts only using an unbiased methodology and our articles are not intended to be financial advice. It does not constitute a recommendation to buy or sell any stock, and does not take account of your objectives, or your financial situation. We aim to bring you long-term focused analysis driven by fundamental data. Note that our analysis may not factor in the latest price-sensitive company announcements or qualitative material. Simply Wall St has no position in any stocks mentioned.
Have feedback on this article? Concerned about the content? Get in touch with us directly. Alternatively, email editorial-team@simplywallst.com