
Is It Time to Rethink Tesla's Value After 26% Stock Climb?
- Wondering if Tesla’s latest price tag is a bargain or totally overhyped? You’re not alone. This is the right place to get answers.
- The stock climbed 26.1% in the past year, despite dipping 5.9% over the last week and slipping 8.0% this month. This highlights both its momentum and investor nerves.
- Tesla has kept headlines busy with ongoing developments in self-driving technology and recent government policy debates around electric vehicle incentives. These stories have fueled both newfound optimism and moments of doubt, adding color to its recent price swings.
- Worth noting, Tesla scores a 0 out of 6 on our undervaluation checks. This means there’s plenty to unpack about how the company is being valued. Let’s walk through the typical approaches to valuation, and stay tuned for an even smarter way to look at it by the article’s end.
Tesla scores just 0/6 on our valuation checks. See what other red flags we found in the full valuation breakdown.
Approach 1: Tesla Discounted Cash Flow (DCF) Analysis
A Discounted Cash Flow (DCF) model estimates a company's intrinsic value by forecasting its future cash flows and discounting them back to today's value. The idea is to approximate what all future cash generated by Tesla is worth in today's dollars.
Currently, Tesla generates around $6.40 Billion in Free Cash Flow (FCF). Analyst estimates cover the next several years, projecting FCF to rise to $23.42 Billion by 2029. Beyond that, projections are extrapolated, with expectations that annual cash flows could reach $59.78 Billion by 2035. These forecasts are based on anticipated growth in Tesla’s business and vary in confidence. The nearer years reflect more analyst consensus, while long-term numbers rely more on trend-based estimates.
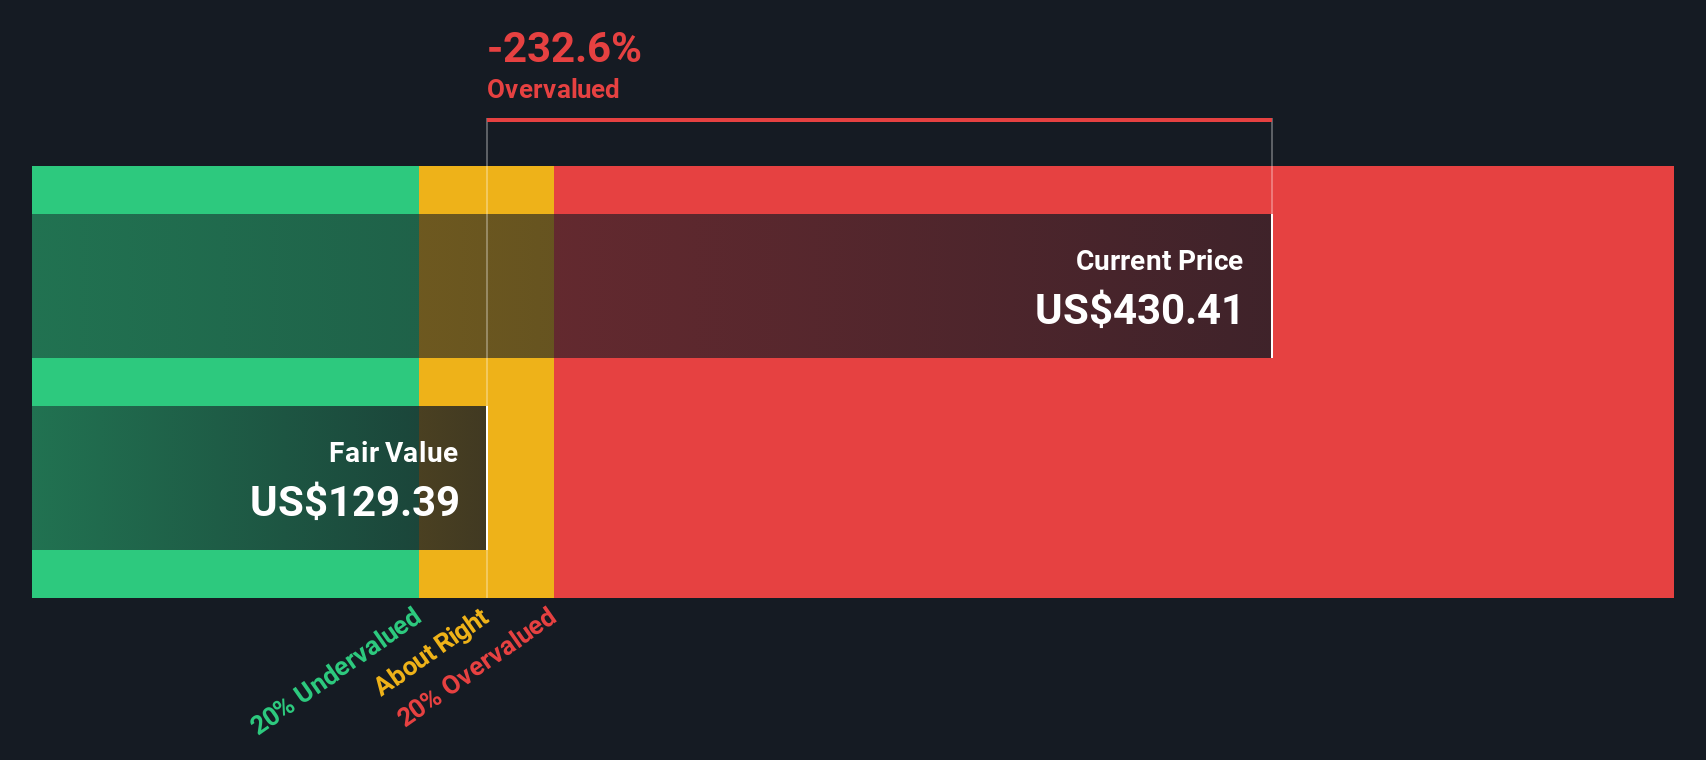
The DCF model used here is the "2 Stage Free Cash Flow to Equity" approach, which factors in both near-term analyst forecasts and longer-term growth assumptions. After discounting all projected cash flows back to today, the model calculates Tesla’s estimated intrinsic value at $155.17 per share.
Comparing this value to Tesla’s current share price reveals a 160.6% overvaluation according to DCF analysis. This means the stock trades significantly above what its projected cash generation might justify today.
Result: OVERVALUED
Our Discounted Cash Flow (DCF) analysis suggests Tesla may be overvalued by 160.6%. Discover 886 undervalued stocks or create your own screener to find better value opportunities.
Approach 2: Tesla Price vs Sales (P/S Ratio)
For companies that are profitable and have significant growth potential, the price-to-sales (P/S) ratio is often a preferred valuation tool. Unlike earnings, which can be distorted by one-time events or accounting adjustments, sales figures typically provide a clearer, more stable view of a company’s overall business trajectory.
Growth expectations and risk profile play a big role in what a “normal” or “fair” P/S ratio should be. Companies with strong sales growth or disruptive business models, like Tesla, often command higher P/S multiples, while those in mature or riskier markets typically trade closer to industry averages.
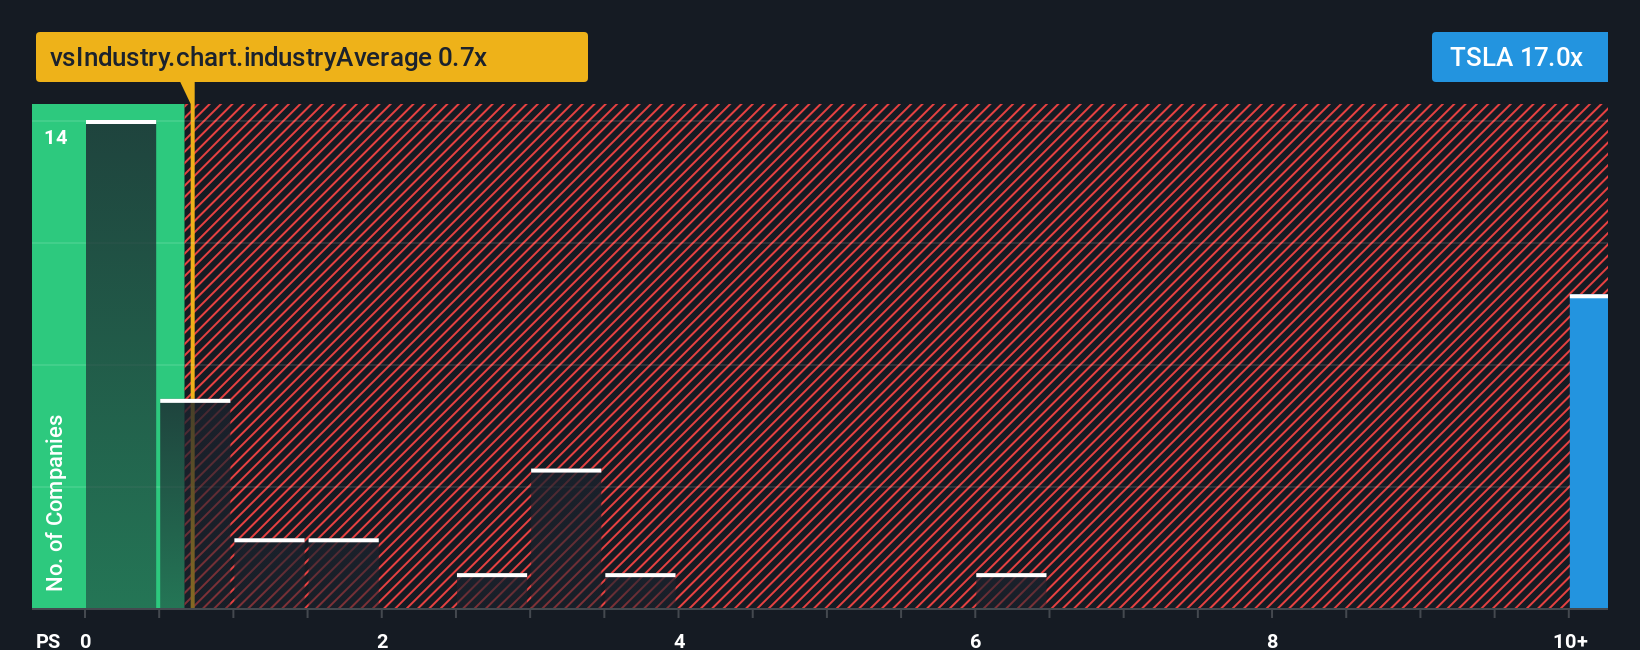
As of now, Tesla’s P/S ratio is 14.06x, far higher than the auto industry average of 0.99x and its peer average of 1.25x. On the surface, this premium suggests investors are pricing in exceptional growth and market dominance. However, benchmarks like peers and industry can be misleading since they do not account for the unique aspects of Tesla’s business.
That is where Simply Wall St’s proprietary “Fair Ratio” comes into play. This metric considers Tesla’s earnings growth, industry dynamics, profit margins, size, and risk profile to arrive at a more tailored valuation yardstick. For Tesla, the Fair Ratio is calculated at 3.44x, which is much lower than its current P/S multiple. Because this custom benchmark adjusts for Tesla’s specific strengths and challenges, it is a more reliable guide than simply looking at the broader industry or peer group.
Comparing the Fair Ratio of 3.44x with Tesla’s actual P/S of 14.06x, there is a wide gap. This means the stock is trading well above what its fundamentals suggest as fair value using this metric.
Result: OVERVALUED
PS ratios tell one story, but what if the real opportunity lies elsewhere? Discover 1410 companies where insiders are betting big on explosive growth.
Upgrade Your Decision Making: Choose your Tesla Narrative
Earlier we mentioned that there is an even better way to understand valuation, so let us introduce you to Narratives. A Narrative is the story you believe about a company’s future, expressed through your own estimates and assumptions, such as future revenue, earnings, margins, and how you define fair value. Rather than just relying on a single model or analyst forecast, Narratives help you connect your perspective on Tesla’s business to what you think it’s worth. This is easy and accessible through the Simply Wall St platform’s Community page, where millions of investors share and update their Narratives as new information such as news or earnings emerges.
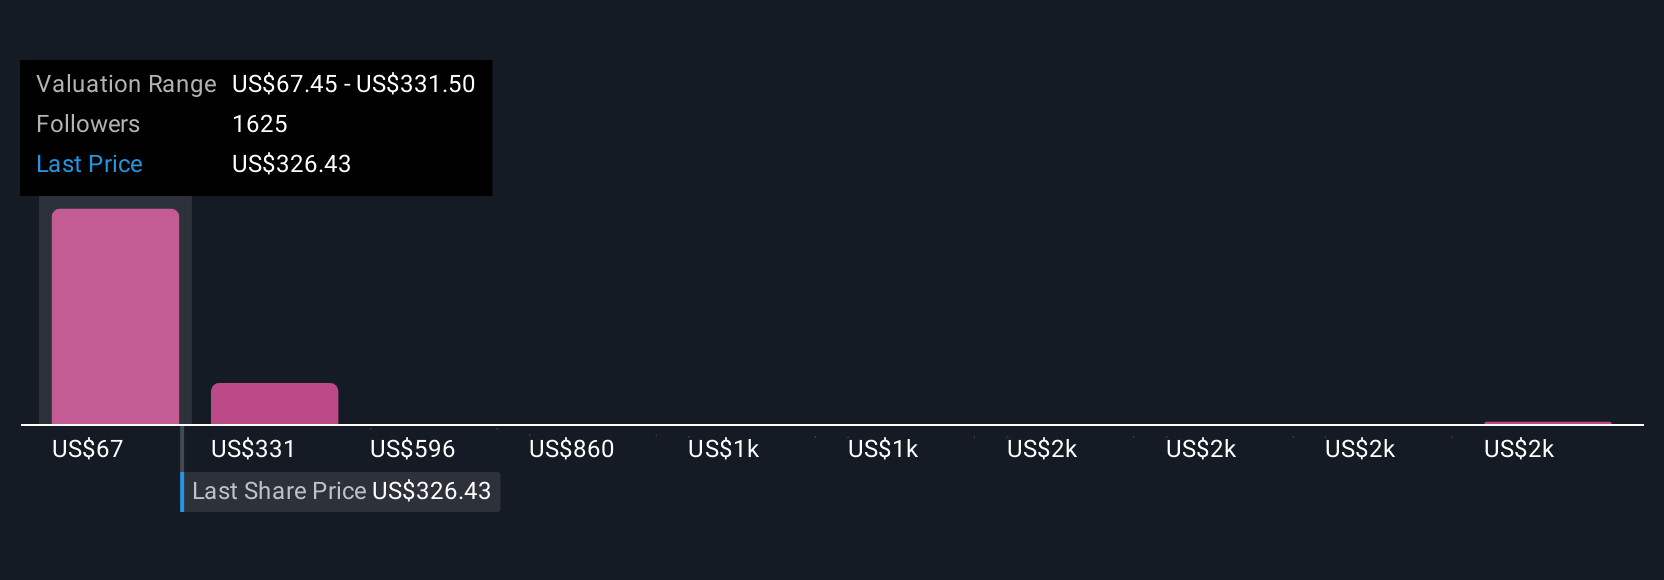
Narratives empower you to see how your view stacks up by showing your calculated Fair Value next to the current share price, making it much clearer to decide when to buy or sell. Because Narratives update dynamically with real-world events, your investment decisions always reflect the latest facts. For example, some investors see Tesla as “just a car company” and estimate fair value as low as $67 per share, while others see a future tech giant with estimates above $2,700, so your Narrative can reflect the story you believe in.
For Tesla, we'll make it really easy for you with previews of two leading Tesla Narratives:
Fair Value Estimate: $2,707.91
Current Price vs. Fair Value: 85.1% below narrative fair value
Revenue Growth Rate Assumed: 77%
- Projects Tesla evolving beyond cars, leading AI, robotics, energy, and software with five major revenue streams.
- Forecasts 2030 revenue at $1.94 trillion and net profit of $534 billion, with a 25-27.5% margin, driving a base case fair value for today of approximately $2,968 per share (with bear and bull scenarios provided).
- Views today’s share price as drastically undervalued, assuming Tesla executes on AI, FSD, and energy businesses at scale, while acknowledging competitive and execution risks.
Fair Value Estimate: $332.71
Current Price vs. Fair Value: 21.6% above narrative fair value
Revenue Growth Rate Assumed: 30%
- Highlights ambitious new products and services (Cybertruck, Model 2, FSD, Optimus robots), but also emphasizes execution, competition, and regulatory risks.
- Projects 2030 revenue of approximately $150 billion with profit margins of 20-22%, reflecting strong but more conservative growth.
- Assumes Tesla is overvalued today, as anticipated growth and innovation face headwinds from supply chain, competition, and regulatory issues.
Do you think there's more to the story for Tesla? Head over to our Community to see what others are saying!
This article by Simply Wall St is general in nature. We provide commentary based on historical data and analyst forecasts only using an unbiased methodology and our articles are not intended to be financial advice. It does not constitute a recommendation to buy or sell any stock, and does not take account of your objectives, or your financial situation. We aim to bring you long-term focused analysis driven by fundamental data. Note that our analysis may not factor in the latest price-sensitive company announcements or qualitative material. Simply Wall St has no position in any stocks mentioned.
Have feedback on this article? Concerned about the content? Get in touch with us directly. Alternatively, email editorial-team@simplywallst.com