
Is Cadence Design Systems Worth Its Premium After AI and Automotive Wins in 2025?
- Ever find yourself wondering whether Cadence Design Systems’ shares are really worth the premium, or if there’s hidden value being overlooked? You’re not alone, and this is the right place for a closer look.
- While the stock has delivered a solid 8.7% return over the past full year, some shorter-term turbulence is evident with a 3.1% decline in the past week and a 2.8% drop over the last month, despite a healthy 5.8% return year-to-date.
- Recent news has highlighted how the semiconductor and software industries are navigating increased demand and evolving chip design challenges, fueling ongoing debates about growth potential. Major design wins for AI and automotive applications have kept Cadence in the spotlight as both an innovator and an industry leader.
- When it comes to valuation, Cadence Design Systems scores just 1 out of 6 on our undervaluation checks. It is worth digging into how that number is calculated and why there may be a smarter way to interpret a company’s value than just running the standard ratios.
Cadence Design Systems scores just 1/6 on our valuation checks. See what other red flags we found in the full valuation breakdown.
Approach 1: Cadence Design Systems Discounted Cash Flow (DCF) Analysis
A Discounted Cash Flow (DCF) model estimates a company's intrinsic value by projecting its future cash flows and discounting them back to today's value. For Cadence Design Systems, this approach starts with its current Free Cash Flow, which stands at $1.47 billion. Analysts provide detailed forecasts for the next five years. In addition, Simply Wall St extends these estimates for the following five years.
According to these projections, Cadence Design Systems’ Free Cash Flow is expected to grow steadily, reaching approximately $2.44 billion in 2029. The ten-year forecast illustrates a consistent upward trend, with each year’s FCF discounted to reflect today’s dollars. This results in a nuanced estimate that aims to capture both near-term analyst expectations and long-term company performance.
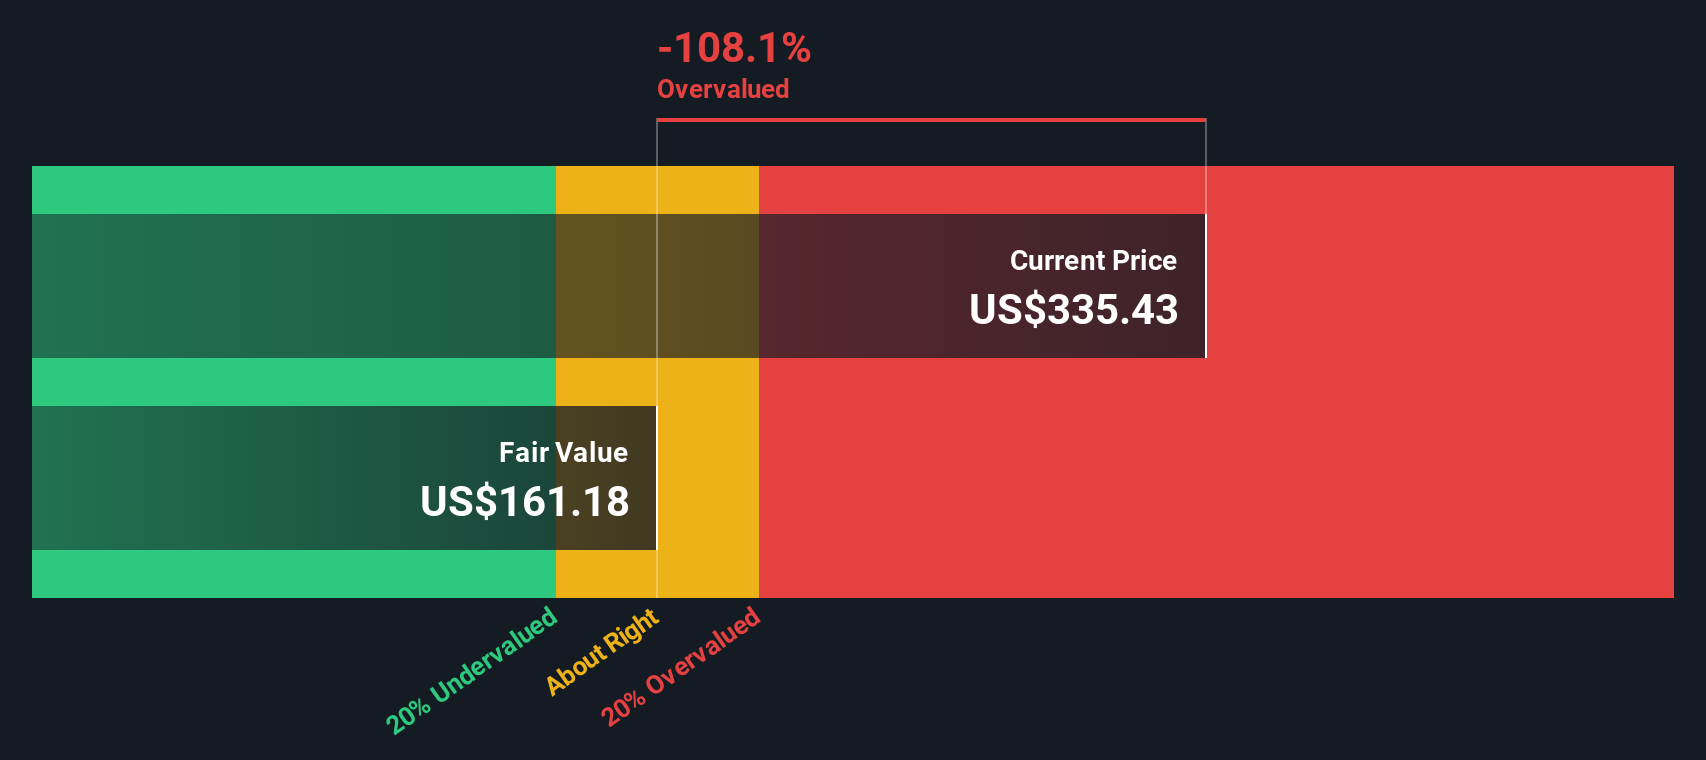
Based on the 2 Stage Free Cash Flow to Equity model, the DCF analysis puts Cadence’s intrinsic value per share at $163.07. This is significantly below the current trading price, and the stock is deemed about 93.1% overvalued by this measure. While expectations for continued FCF growth are built in, the current market premium appears difficult to justify on cash flows alone.
Result: OVERVALUED
Our Discounted Cash Flow (DCF) analysis suggests Cadence Design Systems may be overvalued by 93.1%. Discover 879 undervalued stocks or create your own screener to find better value opportunities.
Approach 2: Cadence Design Systems Price vs Earnings
For profitable technology companies like Cadence Design Systems, the Price-to-Earnings (PE) ratio is a widely accepted valuation metric. It helps investors understand how much they are paying for every dollar of current earnings, making it a go-to gauge for established firms that consistently generate profits.
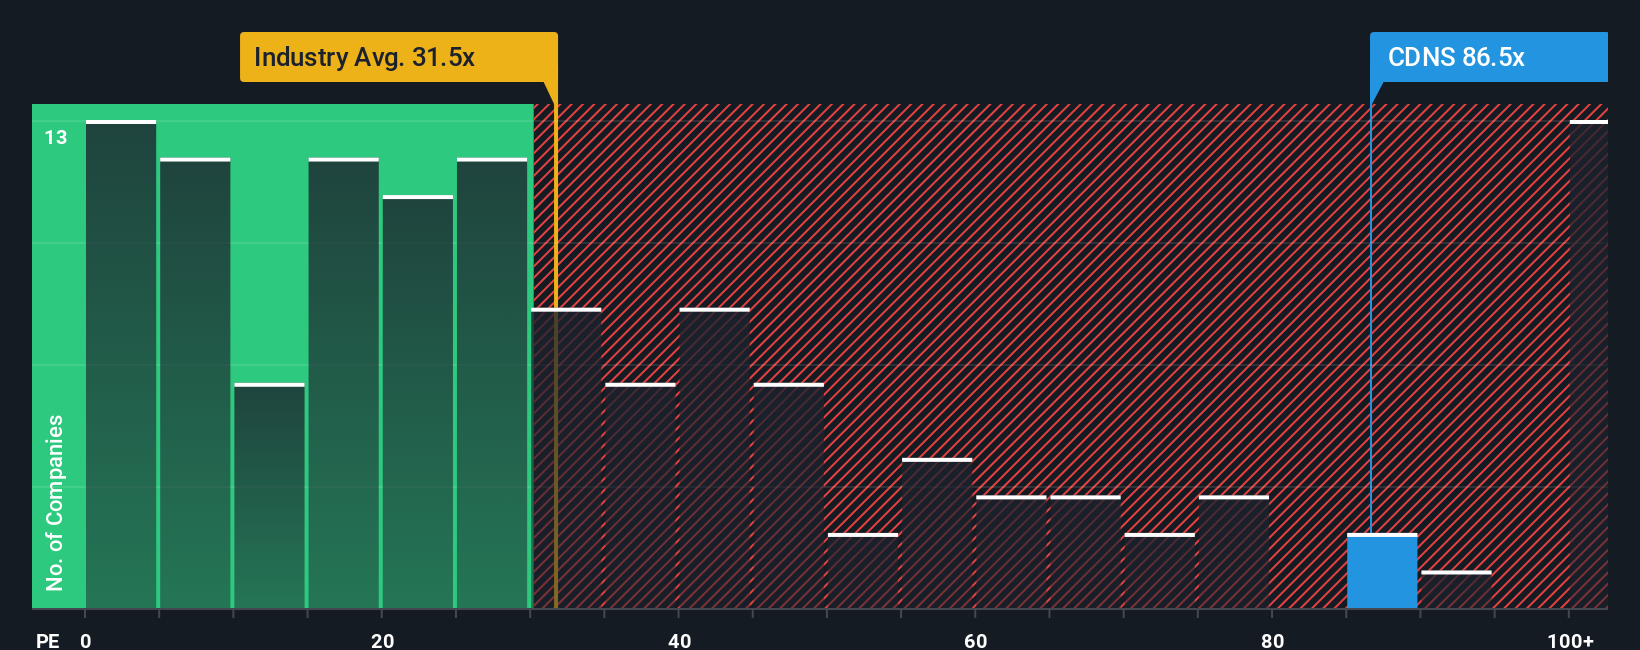
Typically, a "normal" or "fair" PE ratio considers a company’s future growth prospects and perceived risks. Rapid growth companies often justify higher PE ratios, while greater risk or slowing expansion may push the fair multiple lower. For Cadence, the current PE ratio stands at 80.8x, which is notably above the software industry average of 32.7x and higher than the peer group average of 62.2x.
Simply Wall St’s proprietary Fair Ratio for Cadence is 43.0x. The Fair Ratio offers a more tailored comparison by factoring in not just broad industry benchmarks, but also the company’s expected growth, profit margins, unique risks, and market cap. This provides a deeper lens than simply comparing to other software companies or peers.
With the stock trading at nearly double its Fair Ratio, Cadence Design Systems appears to be overvalued under this approach. The market is pricing in a lot of future success and growth, but the premium looks hard to justify on earnings alone.
Result: OVERVALUED
PE ratios tell one story, but what if the real opportunity lies elsewhere? Discover 1405 companies where insiders are betting big on explosive growth.
Upgrade Your Decision Making: Choose your Cadence Design Systems Narrative
Earlier we mentioned that there is an even better way to understand valuation, so let’s introduce you to Narratives. A Narrative is a simple, story-driven way to express your own perspective on a company by connecting the business’s story, including aspects such as AI innovation, partnerships, or risks, to your personal forecasts for future revenue, earnings, and margins. These elements then link directly to your own fair value estimate.
Using Narratives helps you go beyond the usual valuation ratios by weaving business context and assumptions into a forecast, making it easier to see how the company’s journey might play out financially and what you believe it is truly worth. Narratives are easy to use and available to everyone in the Simply Wall St Community, where millions of investors share, debate, and update their views.
This tool helps you decide when to buy or sell, as your Narrative’s fair value is automatically compared to Cadence Design Systems’ current price and dynamically updates whenever fresh news, earnings, or market events occur. For Cadence, Narratives range widely; some investors see ultra-bullish upside, expecting a fair value as high as $410, while the most cautious set their estimate at $200, all based on their unique read of the company’s future.
Do you think there's more to the story for Cadence Design Systems? Head over to our Community to see what others are saying!

This article by Simply Wall St is general in nature. We provide commentary based on historical data and analyst forecasts only using an unbiased methodology and our articles are not intended to be financial advice. It does not constitute a recommendation to buy or sell any stock, and does not take account of your objectives, or your financial situation. We aim to bring you long-term focused analysis driven by fundamental data. Note that our analysis may not factor in the latest price-sensitive company announcements or qualitative material. Simply Wall St has no position in any stocks mentioned.
Have feedback on this article? Concerned about the content? Get in touch with us directly. Alternatively, email editorial-team@simplywallst.com