
Analyzing nVent Electric’s Value After Strong 54.7% Rally and Recent Industry Partnerships
- Wondering if nVent Electric is still a smart buy after its impressive performance? You are not alone, as plenty of investors are eyeing its stock for clues about future value.
- The company’s shares have surged 54.7% year-to-date and 44.8% over the past year, but did drop 3.7% in the last week. This hints at both strong momentum and shifting market sentiment.
- Recently, nVent Electric has been closing deals and capturing headlines for its role in strengthening infrastructure and energy management, adding momentum to its long-term growth narrative. News of industry partnerships and innovative product launches has contributed to the stock’s recent volatility and renewed attention.
- On a scale of 0 to 6, nVent Electric’s current valuation score is 0, meaning it does not appear undervalued across our main checks right now. Next, we will break down the usual valuation methods and point to an even smarter way to truly understand what the numbers mean for long-term investors.
nVent Electric scores just 0/6 on our valuation checks. See what other red flags we found in the full valuation breakdown.
Approach 1: nVent Electric Discounted Cash Flow (DCF) Analysis
A Discounted Cash Flow (DCF) model estimates a company’s intrinsic value by projecting its future cash flows and discounting them back to today’s terms. This approach helps investors see beyond current market sentiment and focus on the company’s underlying earning power.
For nVent Electric, the latest report shows annual Free Cash Flow (FCF) of $405.6 Million. Based on analyst projections, FCF is expected to increase steadily, reaching approximately $933 Million by 2029. After analysts’ 5-year estimates, Simply Wall St extrapolates further using historical trends. The projections suggest solid long-term FCF growth over the next decade.
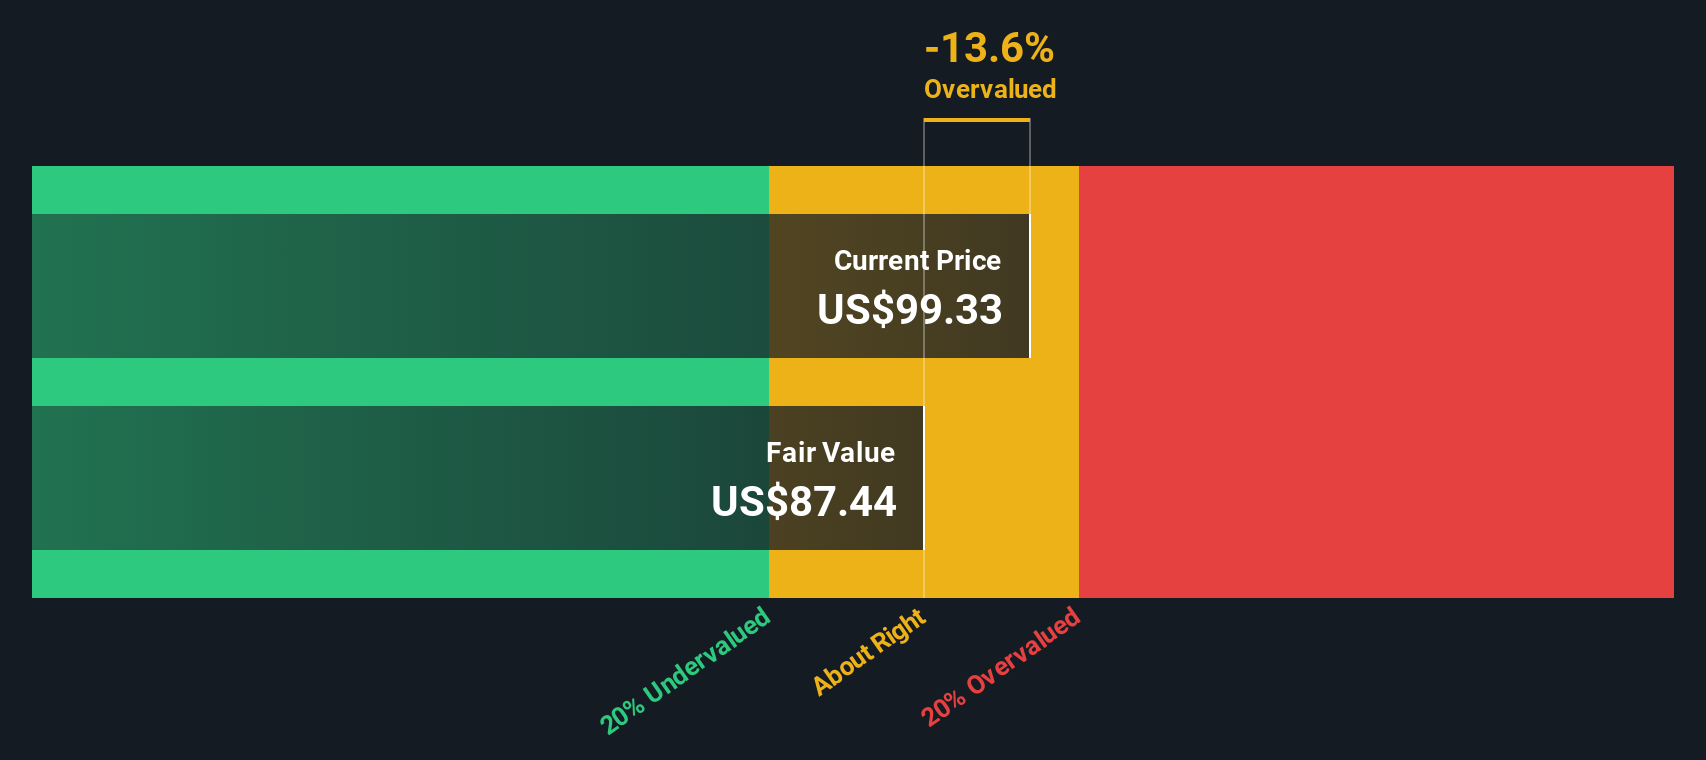
Using these forecasts, the DCF model calculates an intrinsic value of $85.88 per share for nVent Electric. However, based on the current market price, the stock appears to be trading at a 23.3% premium to its fair value. According to this method, nVent Electric is overvalued at present, despite positive cash flow momentum.
Result: OVERVALUED
Our Discounted Cash Flow (DCF) analysis suggests nVent Electric may be overvalued by 23.3%. Discover 885 undervalued stocks or create your own screener to find better value opportunities.
Approach 2: nVent Electric Price vs Earnings (PE)
The Price-to-Earnings (PE) ratio is a widely trusted tool for valuing profitable companies because it directly relates what investors are willing to pay with each dollar of earnings. This makes it especially relevant for established businesses like nVent Electric with consistent profitability.
A company’s “normal” or “fair” PE ratio reflects both its growth outlook and risk profile. Rapidly expanding firms or stable industry leaders often command higher PE ratios, while those with slower growth or more risk are valued less generously by the market.
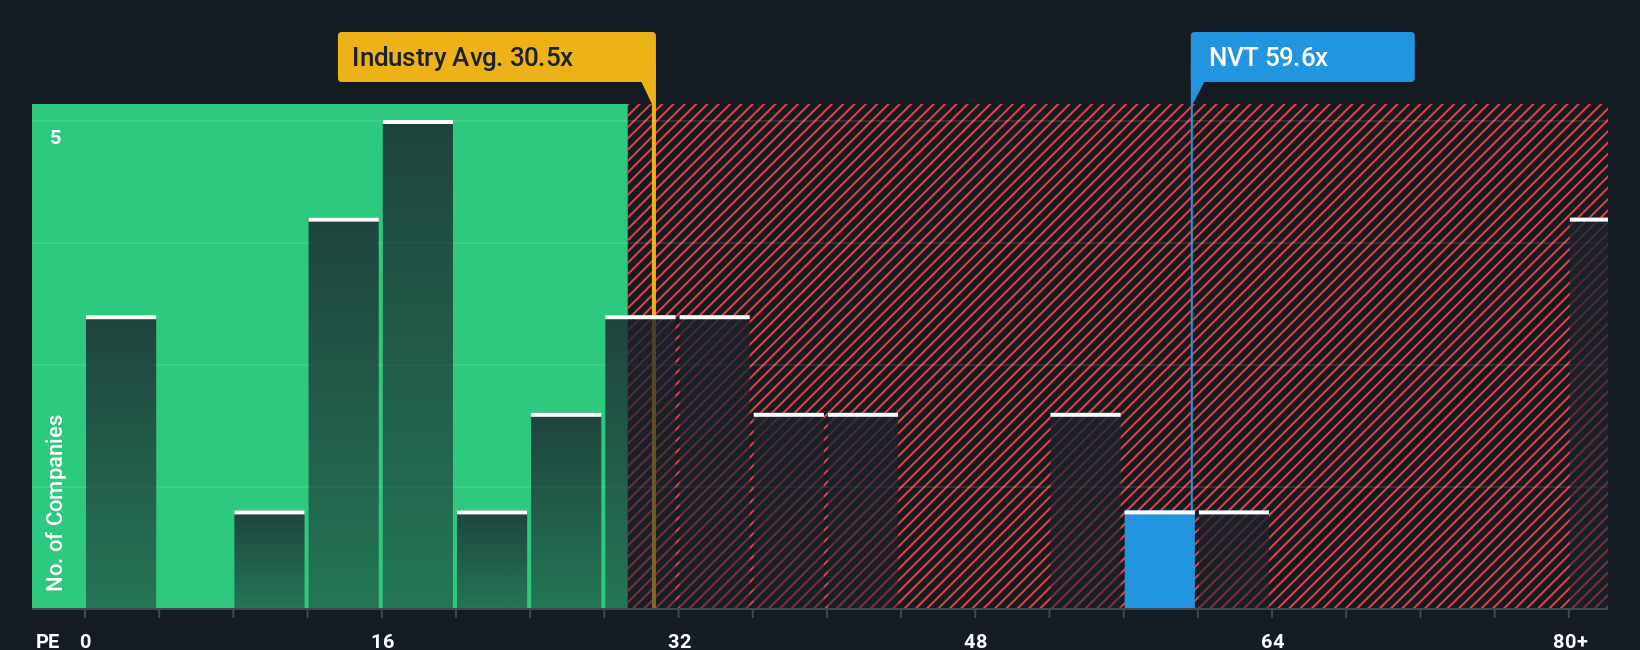
Currently, nVent Electric trades at a PE ratio of 57.7x. This is well above the Electrical industry average of 30.2x, and also much higher than the 28.1x average among its peers. At first glance, such a premium might seem hard to justify, unless the company’s prospects are truly exceptional.
Simply Wall St’s proprietary “Fair Ratio,” tailored with inputs like growth, margins, risks, industry and company size, offers a more nuanced benchmark. In this case, nVent Electric’s Fair PE Ratio is calculated at 35.0x. This is a smarter yardstick than simply citing industry or peer numbers, as it adjusts for what actually matters for shareholders: the company’s earnings trajectory, financial health, and market positioning.
Comparing the Fair Ratio (35.0x) with the actual PE ratio (57.7x) signals that nVent Electric is trading well above what would be considered reasonable given its fundamentals.
Result: OVERVALUED
PE ratios tell one story, but what if the real opportunity lies elsewhere? Discover 1405 companies where insiders are betting big on explosive growth.
Upgrade Your Decision Making: Choose your nVent Electric Narrative
Earlier we mentioned that there is an even better way to understand valuation, so let's introduce you to Narratives. A Narrative is a simple, accessible way to connect your personal story or perspective about nVent Electric, such as what you think about its growth drivers, industry trends, or potential risks, to a financial forecast and a fair value estimate. This means that instead of relying solely on numbers or averages, you consider what matters most to you and see how your view impacts the company's intrinsic value.
Narratives are easy to create and use, and you will find them in the Community page on Simply Wall St, a platform trusted by millions of investors. They work by letting you lay out your assumptions for things like future revenue, earnings, and margins, tying the company's outlook to your fair value estimate. As news or earnings reports come in, Narratives update dynamically so you can quickly reassess your position.
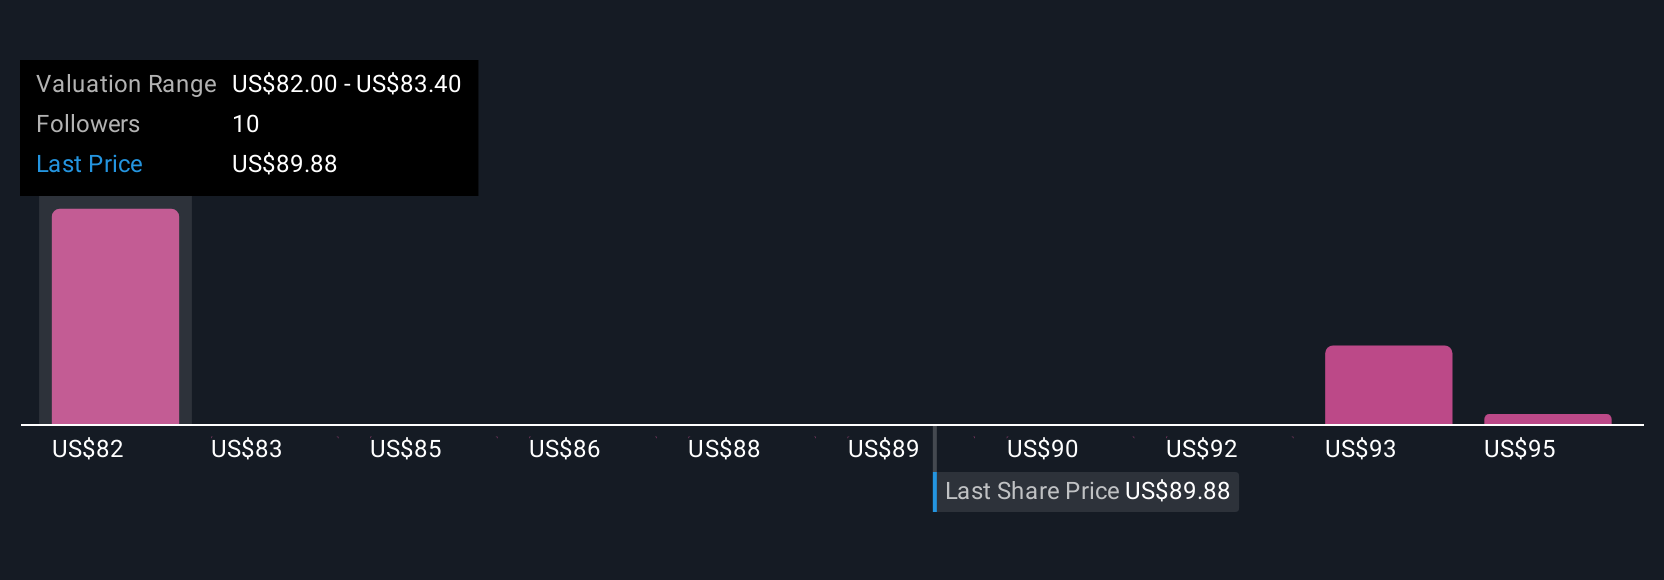
This helps you make sharper decisions by comparing your Fair Value to the latest share price, deciding whether it’s time to buy, hold, or sell based on your own story, not just consensus. For example, in the case of nVent Electric, one investor’s bullish Narrative might estimate a fair value of $105.00 by factoring in rapid expansion and rising demand for data center solutions, while another may see more risk from AI sector reliance and set their fair value much lower, at $68.04.
Do you think there's more to the story for nVent Electric? Head over to our Community to see what others are saying!
This article by Simply Wall St is general in nature. We provide commentary based on historical data and analyst forecasts only using an unbiased methodology and our articles are not intended to be financial advice. It does not constitute a recommendation to buy or sell any stock, and does not take account of your objectives, or your financial situation. We aim to bring you long-term focused analysis driven by fundamental data. Note that our analysis may not factor in the latest price-sensitive company announcements or qualitative material. Simply Wall St has no position in any stocks mentioned.
Have feedback on this article? Concerned about the content? Get in touch with us directly. Alternatively, email editorial-team@simplywallst.com