
Does the Recent Smart Home Expansion Make Arlo a Bargain in 2025?
- Wondering if Arlo Technologies is a hidden gem or priced just right? You are not alone, especially with all eyes on where tech stocks land on the value spectrum.
- While Arlo's shares have soared 61.4% year-to-date and gained an impressive 50.5% over the past year, there have been bumps along the way, including a recent 8.4% dip in the last week.
- News around heightened demand for smart home security and Arlo's latest expansion of its product lineup have kept the stock in the spotlight. Recent analyst discussions suggest increasing confidence in the company’s ability to capture market share amid changing consumer preferences.
- With a current valuation score of 4/6, Arlo passes most but not all of our checks for undervaluation. In this article, we will walk through what that really means by examining the main valuation approaches, and reveal an even better way to judge if the current price is fair. Stay tuned to the end for that perspective.
Approach 1: Arlo Technologies Discounted Cash Flow (DCF) Analysis
A Discounted Cash Flow (DCF) model estimates a company's value by projecting its future cash flows and discounting them back to today's value. This method helps investors determine what a business is worth based on its ability to generate cash in the future.
For Arlo Technologies, the DCF model uses the 2 Stage Free Cash Flow to Equity approach. The company currently reports Free Cash Flow of $60.43 Million, and analysts estimate that FCF could grow significantly over the next decade. Looking ahead, projected Free Cash Flow for 2026 is $79.42 Million and is expected to reach about $186.92 Million in 2035. While detailed forecasts are only available for a few years, longer-term estimates are extrapolated to provide a full picture.
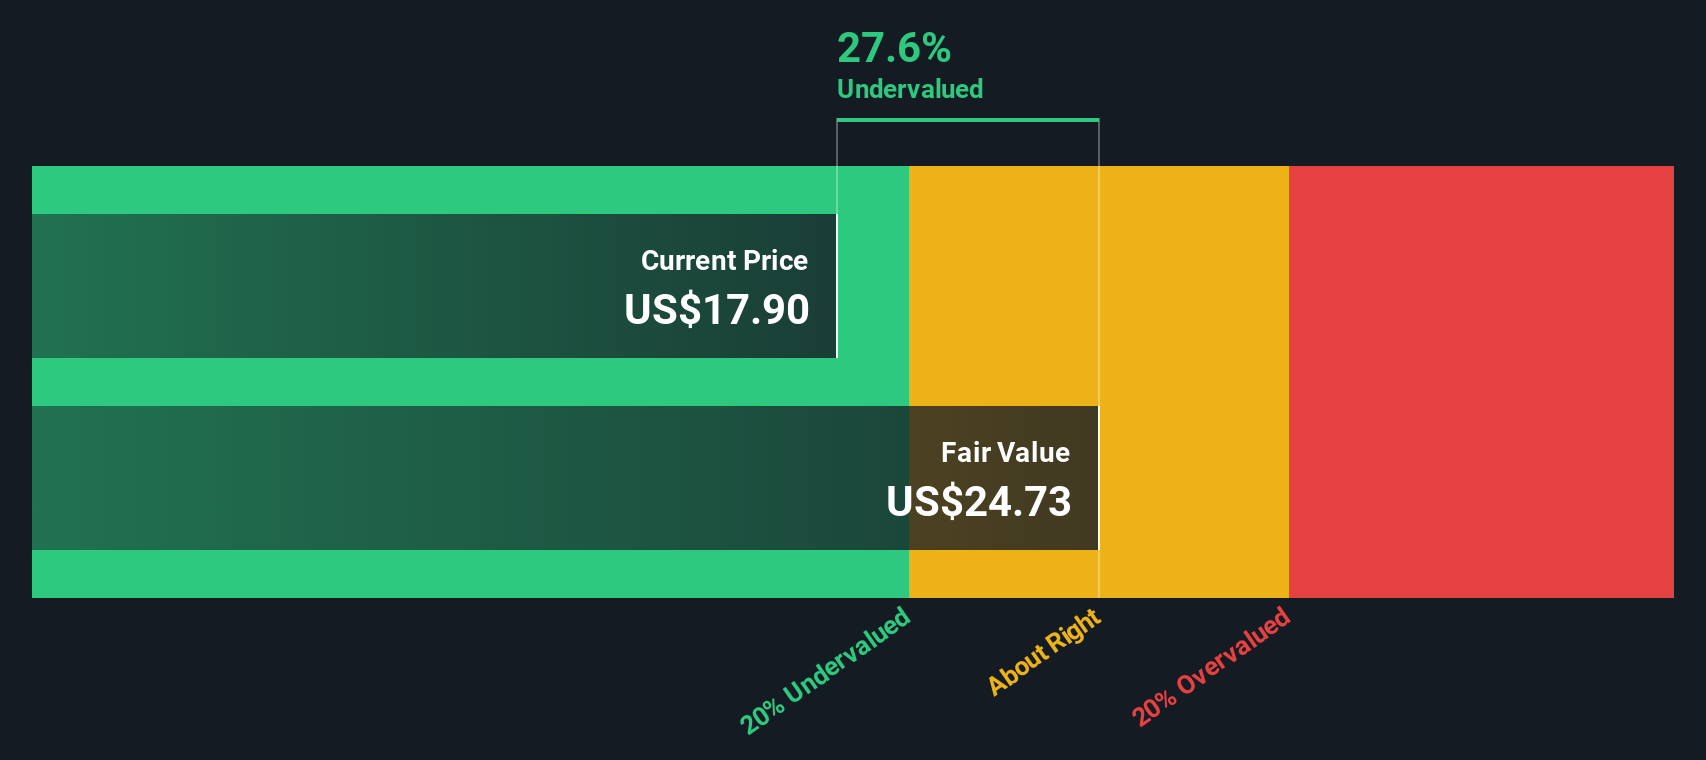
Based on this analysis, the intrinsic value of Arlo's shares is estimated at $24.82. With this value sitting 28.6% above the current share price, the DCF suggests Arlo stock is undervalued by a substantial margin.
Result: UNDERVALUED
Our Discounted Cash Flow (DCF) analysis suggests Arlo Technologies is undervalued by 28.6%. Track this in your watchlist or portfolio, or discover 838 more undervalued stocks based on cash flows.
Approach 2: Arlo Technologies Price vs Sales
For companies like Arlo Technologies that have yet to report steady profits, the Price-to-Sales (P/S) ratio is often the preferred metric for evaluating valuation. Because P/S does not rely on net earnings, it is particularly meaningful for growth-focused tech businesses where rapid expansion can temporarily suppress profits but strong sales still signal underlying momentum.
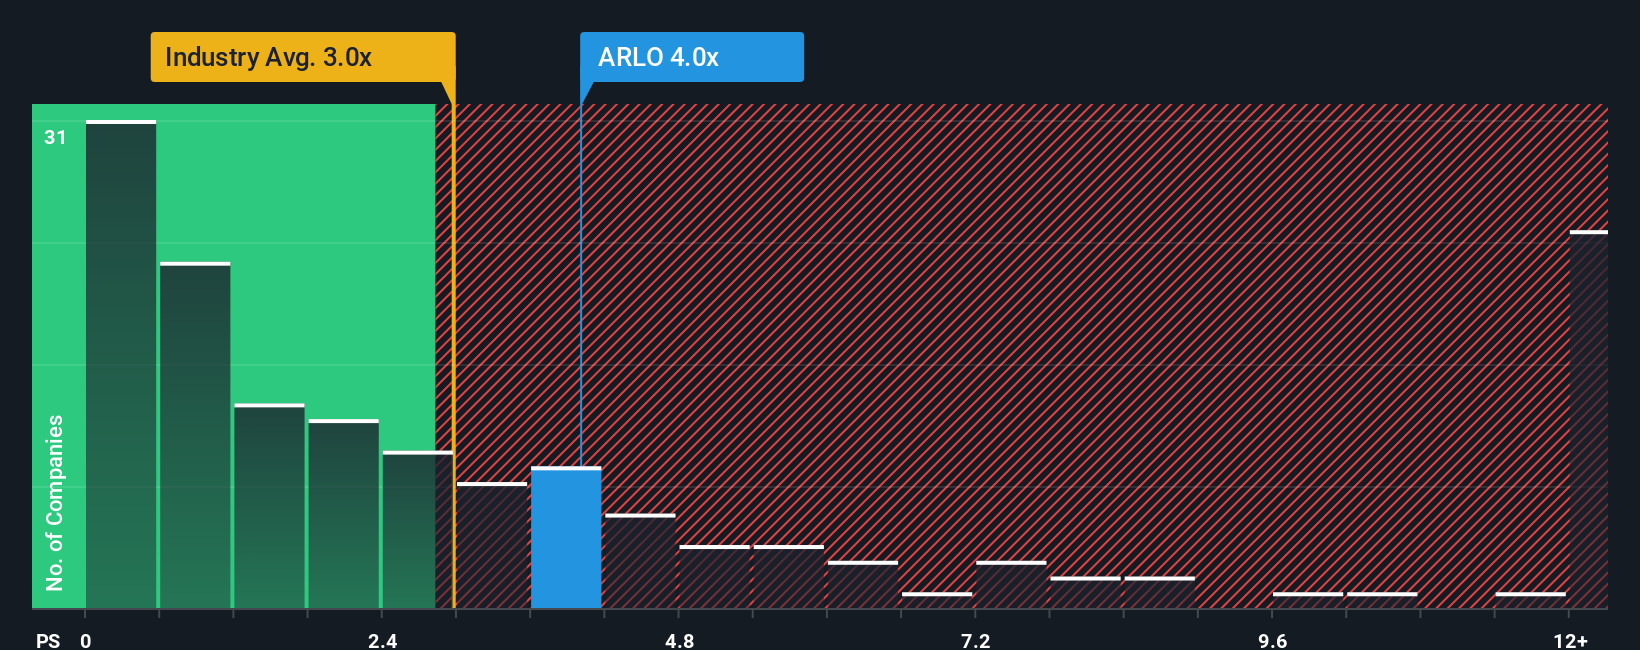
Growth prospects and risk directly affect what constitutes a reasonable P/S ratio. Fast-growing and lower-risk businesses can typically support higher P/S multiples, while lower-growth or riskier firms warrant a discount. Currently, Arlo trades at a P/S ratio of 3.6x. This is above the Electronic industry average of 2.6x but below the average seen among close peers (4.8x).
Simply Wall St's proprietary “Fair Ratio” takes this analysis much deeper. Unlike a simple peer or industry comparison, the Fair Ratio evaluates Arlo’s specific growth trajectory, profit margin profile, size, and risk factors, arriving at what is considered a balanced valuation multiple. For Arlo, the Fair Ratio is calculated at 2.1x. Since this figure is noticeably lower than Arlo’s actual P/S multiple, it suggests the market is assigning a slight premium beyond what fundamentals might justify.
Result: OVERVALUED
PS ratios tell one story, but what if the real opportunity lies elsewhere? Discover 1403 companies where insiders are betting big on explosive growth.
Upgrade Your Decision Making: Choose your Arlo Technologies Narrative
Earlier we mentioned there's an even better way to understand valuation, so let's introduce you to Narratives. A Narrative is a user-generated story behind the numbers. It is your personal perspective on a company like Arlo Technologies, linking your view of its future (such as what you expect for growth, earnings, and margins) to a concrete financial forecast and, ultimately, to a fair value estimate.
Narratives empower you to turn company research into actual investment decisions by making assumptions explicit and connecting them to real numbers. On Simply Wall St’s Community page, millions of investors craft Narratives that automatically update as news or earnings emerge. Your view always reflects the latest information. Narratives are easy to create and compare, offering a simple framework to decide when to buy or sell by showing if your calculated Fair Value is above or below today’s price.
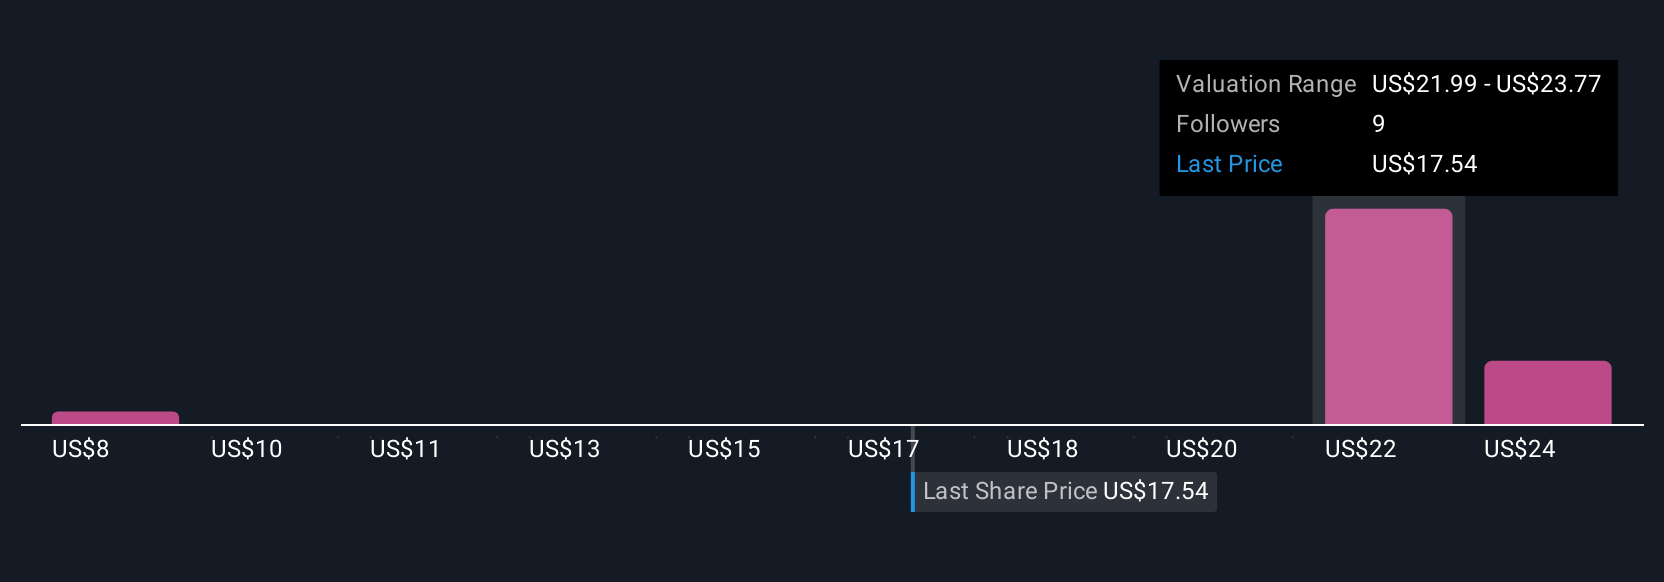
For example, some Narratives for Arlo Technologies are quite bullish, estimating a fair value of $26.00 based on strong subscriber growth and major partnerships, while more cautious investors, worried about competition and profitability, arrive at values as low as $22.00. With Narratives, you get to explore both sides and create your own, making smarter, more confident decisions.
Do you think there's more to the story for Arlo Technologies? Head over to our Community to see what others are saying!
This article by Simply Wall St is general in nature. We provide commentary based on historical data and analyst forecasts only using an unbiased methodology and our articles are not intended to be financial advice. It does not constitute a recommendation to buy or sell any stock, and does not take account of your objectives, or your financial situation. We aim to bring you long-term focused analysis driven by fundamental data. Note that our analysis may not factor in the latest price-sensitive company announcements or qualitative material. Simply Wall St has no position in any stocks mentioned.
Have feedback on this article? Concerned about the content? Get in touch with us directly. Alternatively, email editorial-team@simplywallst.com