
- PREMIUM
- LIVE QUOTES
- INSTITUTIONS
 Index Options
 State Street
 CME Group
 Nasdaq
 Cboe
Cboe TradingView
 Wall Street Journal
Is BASF’s Share Price a Bargain After Latest Green Energy Investments?
- Curious about whether BASF stock is a real bargain or just looks cheap at first glance? You are not alone, as questions about its true value have sparked plenty of debate among investors lately.
- BASF’s share price has edged slightly lower this year, down 1.8% year-to-date, and has been broadly flat over the past year, returning just 0.1%.
- Recent market movements reflect heightened attention to the company's strategic decisions and industry headwinds, including increased input costs and global macroeconomic uncertainty. News of BASF’s ongoing investment in green energy, along with industry-wide supply chain challenges, has kept the stock in the spotlight and investors on their toes.
- BASF scores 2 out of 6 on our valuation checks, suggesting some undervaluation signals but also a need for caution. Next, we will break down what goes into a valuation score and discuss why there may be a smarter method for gauging value before you make your next move.
BASF scores just 2/6 on our valuation checks. See what other red flags we found in the full valuation breakdown.
Approach 1: BASF Discounted Cash Flow (DCF) Analysis
The Discounted Cash Flow (DCF) model estimates the value of BASF by projecting its future cash flows and discounting them back to today's value. This approach helps investors understand what the company is fundamentally worth based on expected cash generation over time.
BASF currently generates around €164 Million of Free Cash Flow (FCF). According to analysts, BASF's annual FCF is projected to grow substantially in the coming years. For example, estimates suggest FCF could exceed €2.2 Billion by 2026 and reach nearly €3.3 Billion by 2029. Beyond 2029, further growth is extrapolated as FCF projections rise year after year.
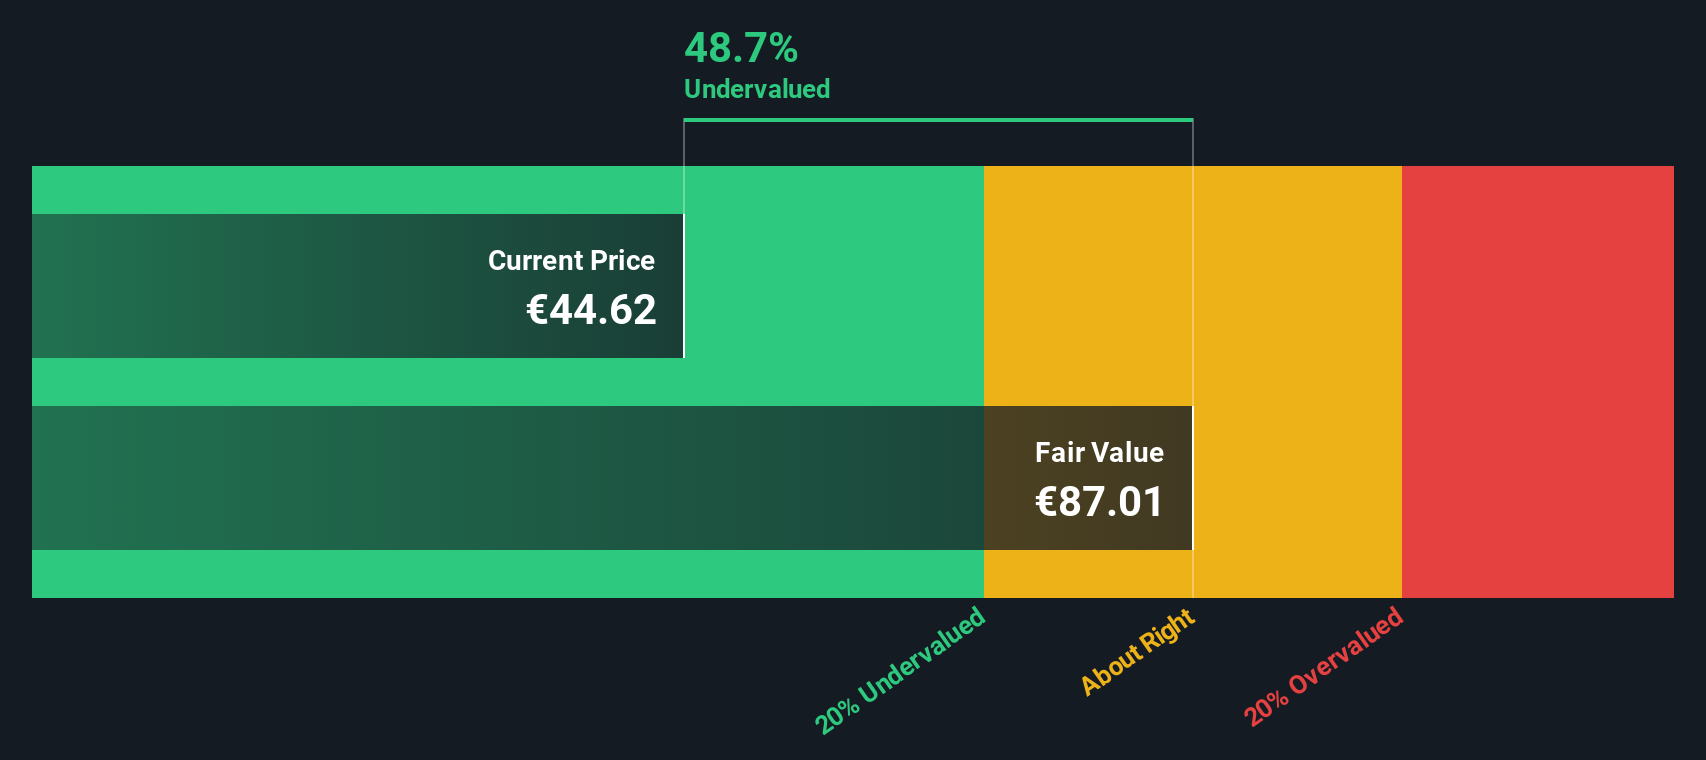
By discounting these future cash flows, the DCF model calculates an estimated fair value for BASF shares of €85.06. This implies the stock is trading at a 50.8% discount to its intrinsic value and suggests it may be significantly undervalued at current prices.
This result indicates that, based on long-term cash flow analysis, BASF looks like a potential bargain for value-focused investors.
Result: UNDERVALUED
Our Discounted Cash Flow (DCF) analysis suggests BASF is undervalued by 50.8%. Track this in your watchlist or portfolio, or discover 840 more undervalued stocks based on cash flows.
Approach 2: BASF Price vs Earnings
The Price-to-Earnings (PE) ratio is often the preferred metric for valuing established, profitable companies like BASF, as it directly compares the company’s share price with its earnings. This ratio gives investors a fast sense of how much they are paying per euro of earnings, offering a clear and widely understood snapshot of valuation.
However, what constitutes a "normal" or fair PE ratio varies; it is shaped by factors such as the company’s growth prospects, profitability, risk, and overall market sentiment. Higher growth companies or those with fewer risks can justify higher multiples, while sluggish or riskier businesses usually trade at a discount.
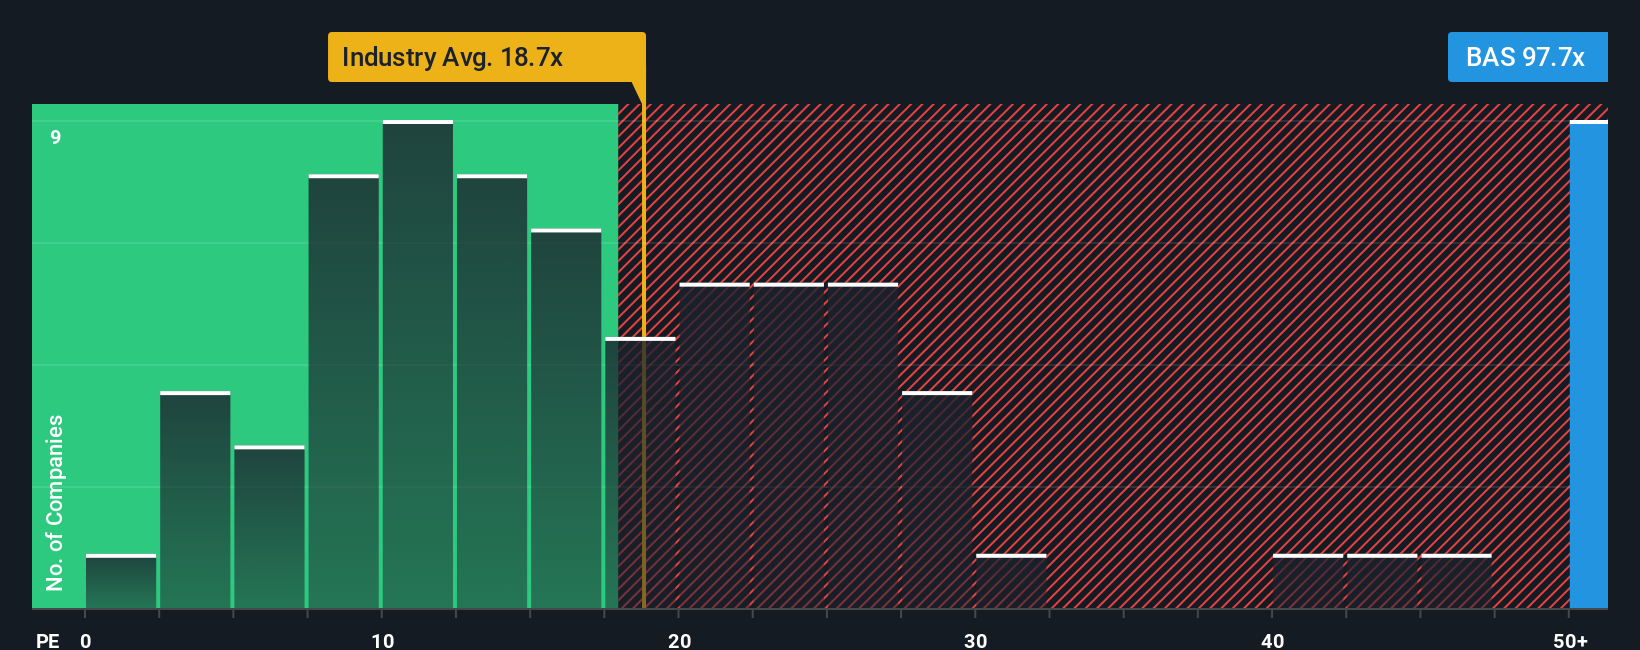
BASF’s current PE ratio stands at 120.88x, which is much higher than both the chemicals industry average of 21.88x and its closest peers at 17.92x. This indicates that the market is pricing in some unique, possibly positive, expectations for BASF that are not reflected in sector averages alone. To sharpen the analysis, Simply Wall St’s proprietary “Fair Ratio” goes further by weighing in aspects like BASF’s earnings growth, industry characteristics, profit margins, market cap, and unique risks. For BASF, this Fair Ratio is 34.31x, making it a much more tailored benchmark than a basic industry or peer comparison.
Comparing the Fair Ratio to BASF’s actual PE highlights a significant difference, with BASF trading well above its fair value multiple. This suggests the stock could be overvalued on traditional earnings measures, even when its prospects and risks are considered.
Result: OVERVALUED
PE ratios tell one story, but what if the real opportunity lies elsewhere? Discover 1411 companies where insiders are betting big on explosive growth.
Upgrade Your Decision Making: Choose your BASF Narrative
Earlier we mentioned that there is an even better way to understand valuation, so let's introduce you to Narratives. A Narrative is an investor’s big-picture story about BASF. It is how you connect the numbers (such as fair value, future earnings, and profit margins) to what you believe about the company’s future and the events shaping it. Narratives bridge what is actually happening at BASF with a financial forecast and, ultimately, a calculated fair value for the stock.
On Simply Wall St’s Community page, millions of investors use Narratives as an easy, accessible tool to map their perspective, track how it influences fair value, and decide whether the current price offers good value. Narratives go beyond static ratios or analyst averages by updating dynamically every time new news or company results are released. This lets you see how fresh information might shape your investment view and when it is time to act.
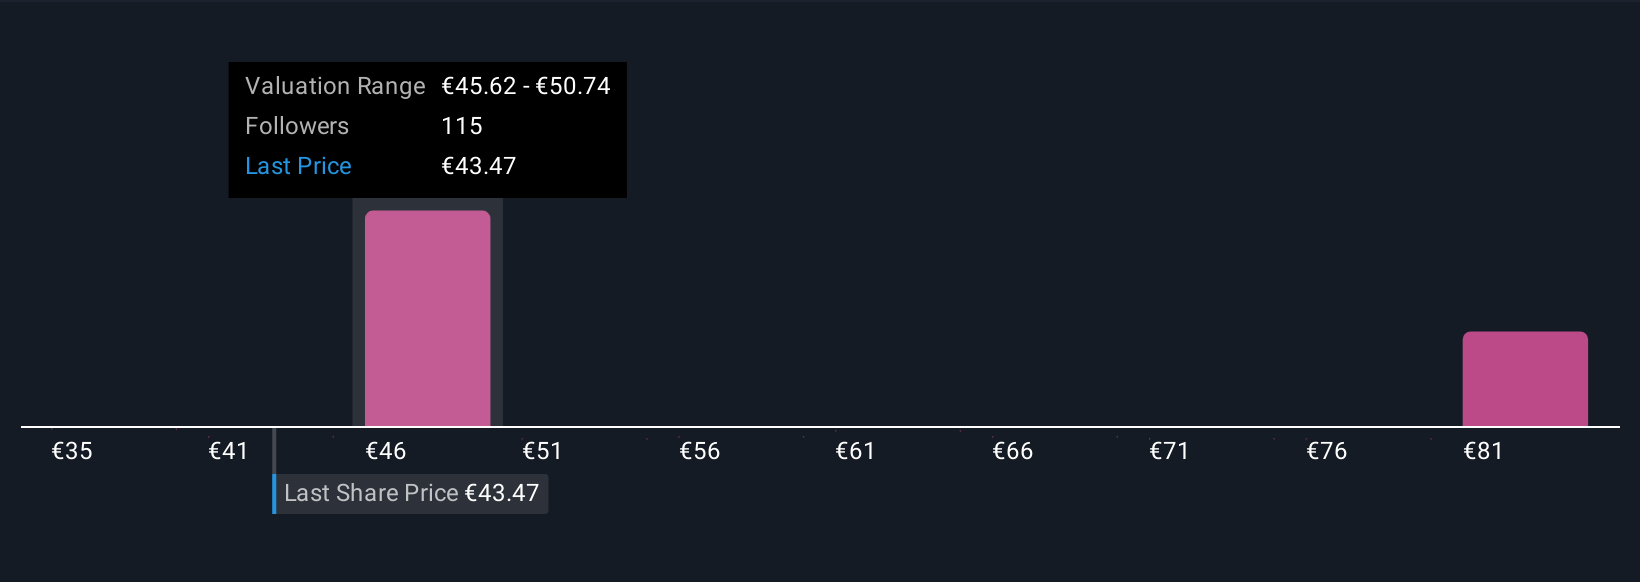
For example, one investor may see strong margin recovery and strategic asset sales as supporting a price target as high as €65. Another, more cautious, user may emphasize European demand risks and see fair value closer to €39. Narratives empower you to compare these viewpoints, visualize the range of possible outcomes, and make smarter decisions based on your own story for BASF.
Do you think there's more to the story for BASF? Head over to our Community to see what others are saying!
This article by Simply Wall St is general in nature. We provide commentary based on historical data and analyst forecasts only using an unbiased methodology and our articles are not intended to be financial advice. It does not constitute a recommendation to buy or sell any stock, and does not take account of your objectives, or your financial situation. We aim to bring you long-term focused analysis driven by fundamental data. Note that our analysis may not factor in the latest price-sensitive company announcements or qualitative material. Simply Wall St has no position in any stocks mentioned.
Have feedback on this article? Concerned about the content? Get in touch with us directly. Alternatively, email editorial-team@simplywallst.com