
Is Nebius Group Still a Bargain After Expansion and a 262% Price Surge?
- Curious if Nebius Group stock is truly a bargain or just riding hype? Let’s break down what the numbers and trends actually reveal.
- After skyrocketing 262.3% year-to-date and 481.8% over the last year, Nebius Group has seen shares fall by 9.3% in the past week and 13.6% in the past month. This hints at shifting sentiment or market uncertainty.
- Recent news has focused on Nebius Group’s high-profile expansion moves and its push into new cloud technologies, which has caught both investor and media attention. These developments are helping shape expectations about future growth and risk around the stock.
- On our valuation checks, Nebius Group scores a 2 out of 6. This suggests there is plenty to discuss when it comes to how the market is pricing this company. As we dive into key valuation approaches, keep in mind there is an even better way to put all this in context coming up later in the article.
Nebius Group scores just 2/6 on our valuation checks. See what other red flags we found in the full valuation breakdown.
Approach 1: Nebius Group Discounted Cash Flow (DCF) Analysis
A Discounted Cash Flow (DCF) model estimates a company's intrinsic value by projecting its future cash flows and discounting them back to their present value. This method helps determine what the company is really worth today, based on expectations for future performance.
For Nebius Group, the DCF model used is the two-stage Free Cash Flow to Equity approach. The company's latest reported Free Cash Flow is negative $658.8 Million, indicating negative cash generation as of the most recent period. Analysts forecast that cash flow will remain negative for several years, with projections turning positive by 2029 at $767.1 Million. From that point, further forecasts show continued increases, with Free Cash Flow projected to reach nearly $3.8 Billion by 2035. Estimates for later years are extrapolated rather than taken directly from analysts.
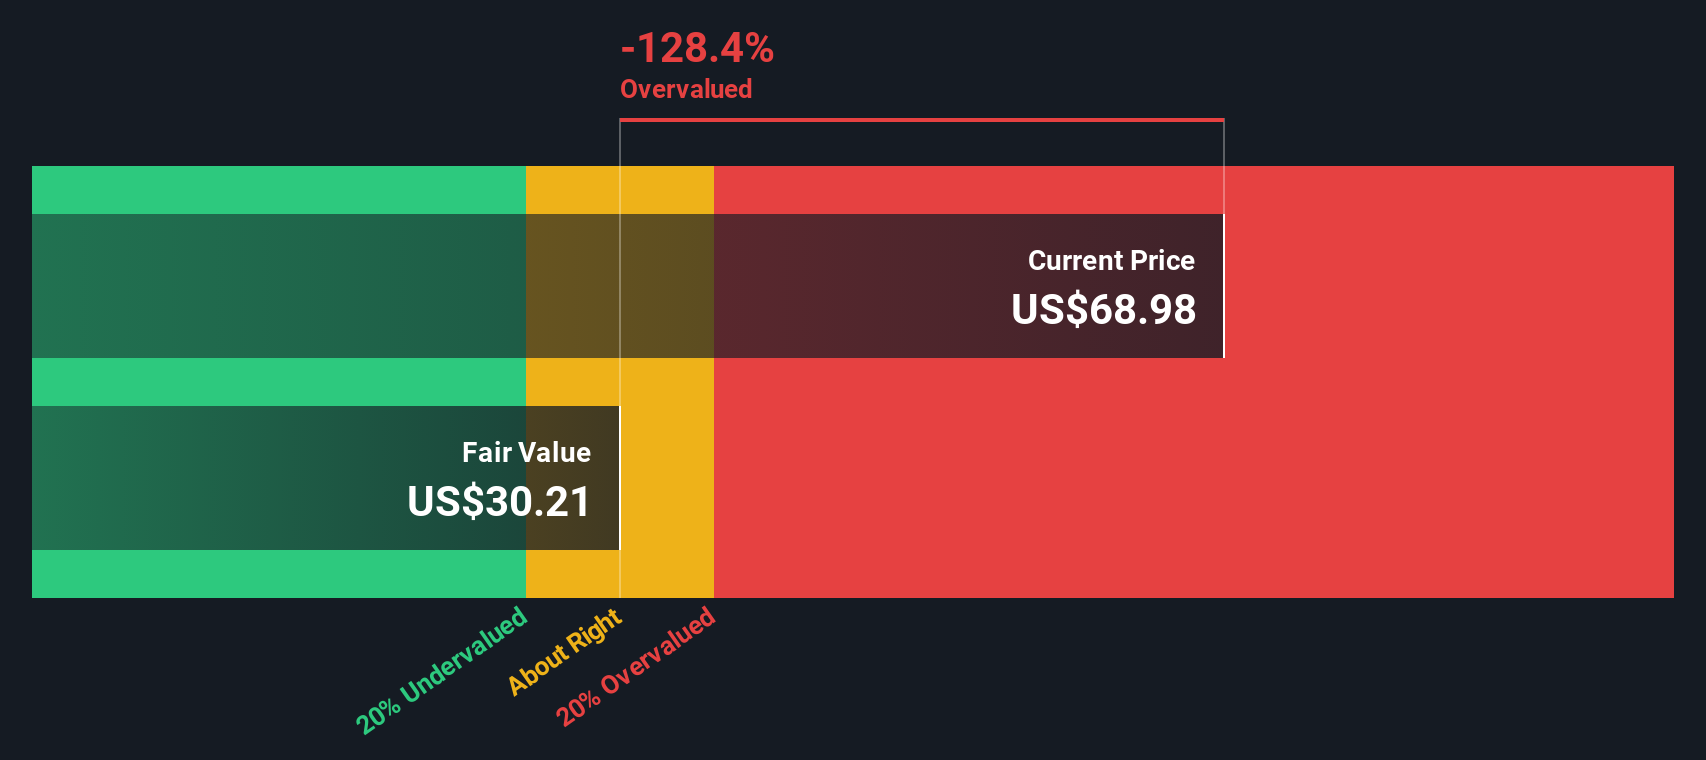
The model concludes that Nebius Group's estimated intrinsic value is $146.44 per share. This suggests the current share price is about 24.5% below what the DCF deems fair value, implying the stock is undervalued given these forecasts and assumptions.
Result: UNDERVALUED
Our Discounted Cash Flow (DCF) analysis suggests Nebius Group is undervalued by 24.5%. Track this in your watchlist or portfolio, or discover 840 more undervalued stocks based on cash flows.
Approach 2: Nebius Group Price vs Earnings
The price-to-earnings (PE) ratio is widely used to value profitable companies as it connects a company’s share price to its bottom line. PE ratios help investors gauge how much the market is willing to pay now for each dollar of earnings, making it a key metric for companies generating profits.
The "normal" or fair PE ratio for a stock is shaped by expectations about future earnings growth and risk. Generally, higher growth prospects or lower perceived risk justify a higher PE multiple, while slower anticipated growth or greater uncertainty warrant a lower multiple.
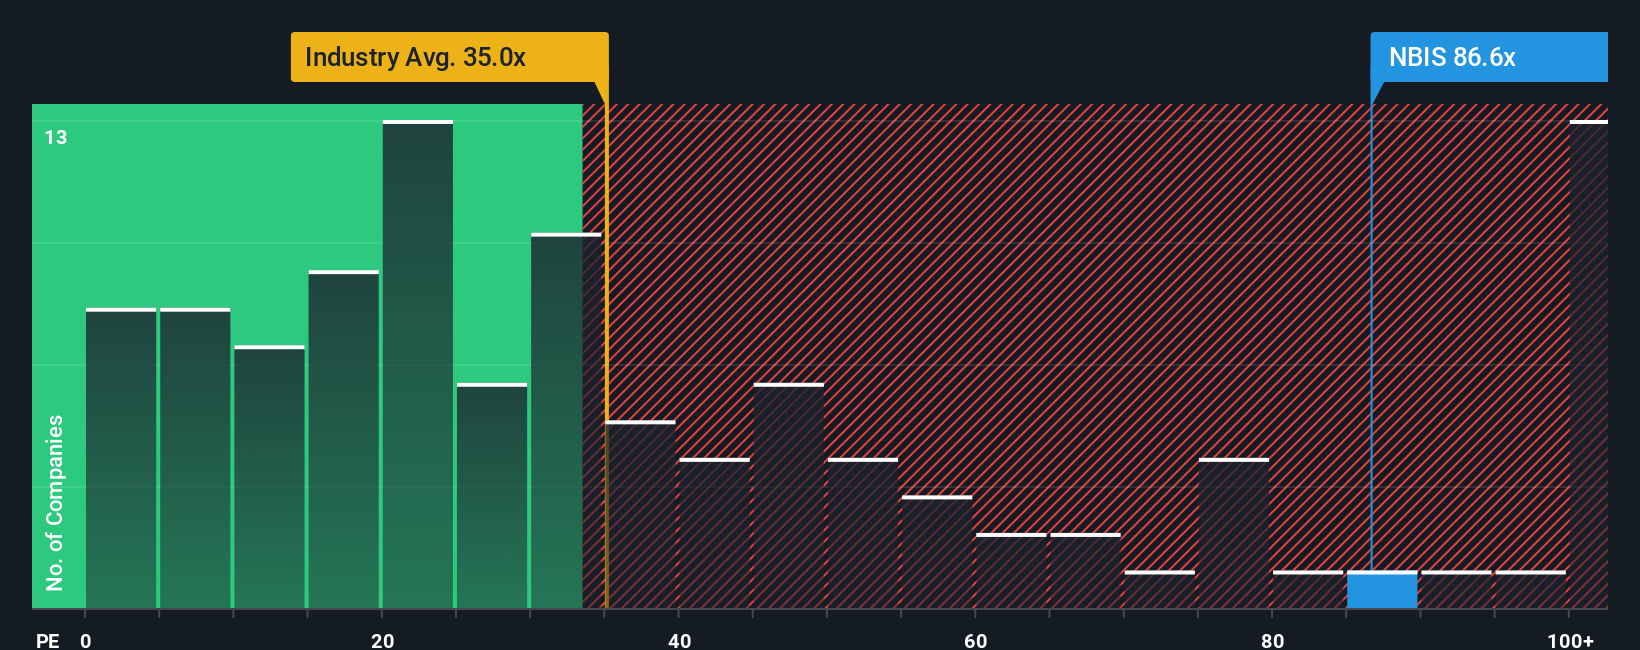
Currently, Nebius Group trades at a PE ratio of 146x, far above the Software industry average of 35x and the peer average of 26x. At first glance, this could suggest the market expects exceptional growth or sees Nebius Group as less risky than its peers. However, benchmarks like industry or peer averages may not reflect the company’s unique outlook.
This is where Simply Wall St’s “Fair Ratio” comes in. The Fair Ratio is a proprietary estimate for Nebius Group’s justified PE multiple, taking into account factors such as its expected earnings growth, industry, profit margins, market cap, and risk profile. This approach offers a more tailored benchmark than generic averages and provides nuanced context about how the stock should be valued today.
Nebius Group’s Fair Ratio is 57x. Comparing this with its actual PE of 146x, the stock appears to be trading at a substantial premium even after adjusting for its growth and other advantages. This suggests that, on a PE basis, Nebius Group is likely overvalued at current prices.
Result: OVERVALUED
PE ratios tell one story, but what if the real opportunity lies elsewhere? Discover 1409 companies where insiders are betting big on explosive growth.
Upgrade Your Decision Making: Choose your Nebius Group Narrative
Earlier we mentioned there is an even better way to understand valuation, so let's introduce you to Narratives. A Narrative is your personal story behind the numbers; it allows you to combine your own assumptions about a company's future revenue, profits, and margins with your beliefs about its industry and risks, then see how those forecasts translate into a fair value estimate.
Narratives bridge the gap between a company’s unique story and quantitative analysis by directly linking your perspective on its future to dynamic financial forecasts and a clear, fair value. On Simply Wall St’s platform, Narratives are easy to use and live on the Community page, used by millions of investors to visualize and update their investment outlooks in real time.
By creating or selecting a Narrative, you can quickly compare your calculated fair value to the current price, helping you decide whether now looks like the right time to buy, hold, or sell. Since Narratives update automatically when fresh news or earnings are released, you will always have a forward-looking and up-to-date decision tool based on the latest available data.
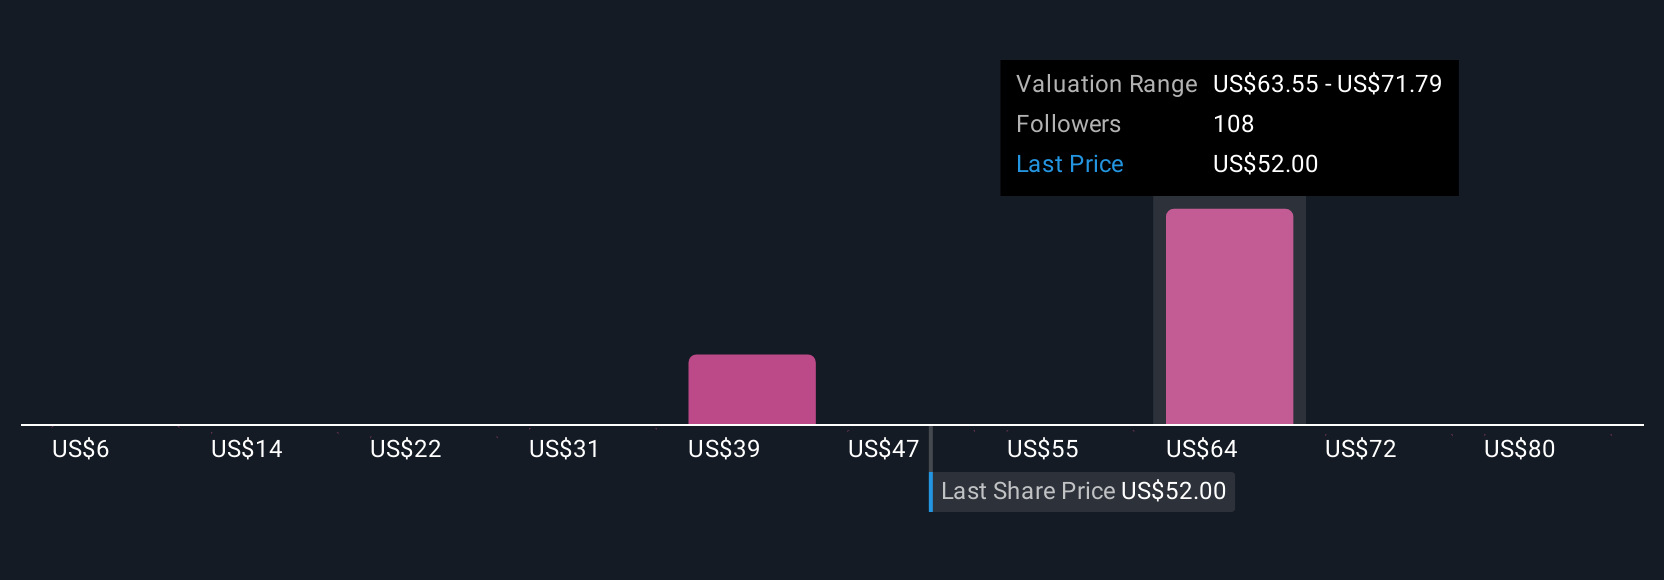
For example, bullish investors in Nebius Group who factor in rapid AI adoption and landmark contracts see fair values as high as $206 per share, while the most cautious, concerned about global competition and tighter regulations, see targets as low as $47. This showcases how different Narratives drive different investment decisions.
Do you think there's more to the story for Nebius Group? Head over to our Community to see what others are saying!
This article by Simply Wall St is general in nature. We provide commentary based on historical data and analyst forecasts only using an unbiased methodology and our articles are not intended to be financial advice. It does not constitute a recommendation to buy or sell any stock, and does not take account of your objectives, or your financial situation. We aim to bring you long-term focused analysis driven by fundamental data. Note that our analysis may not factor in the latest price-sensitive company announcements or qualitative material. Simply Wall St has no position in any stocks mentioned.
Have feedback on this article? Concerned about the content? Get in touch with us directly. Alternatively, email editorial-team@simplywallst.com