
Should You Reassess W. P. Carey’s Value After Recent Property Acquisitions and Market Fluctuations?
- Curious if W. P. Carey is a bargain or too pricey right now? You're not the only one, and diving into its value could reveal some surprising insights.
- While the stock has surged 21.6% year-to-date and delivered an impressive 26.9% return over the past year, it's dipped slightly in recent weeks, down 1.2% over the last 7 days and 3.6% over 30 days. This suggests the market is recalibrating its view.
- Recent headlines have focused on W. P. Carey's strategic moves, including property acquisitions and portfolio adjustments aimed at strengthening its real estate holdings. These updates have caught investor attention as they may reshape the company's growth outlook and future risk profile.
- On our valuation scorecard, W. P. Carey lands right in the middle with a 3 out of 6. That's just the start; let's dig into what those numbers actually mean and explore if there are even smarter ways to assess its true worth later in the article.
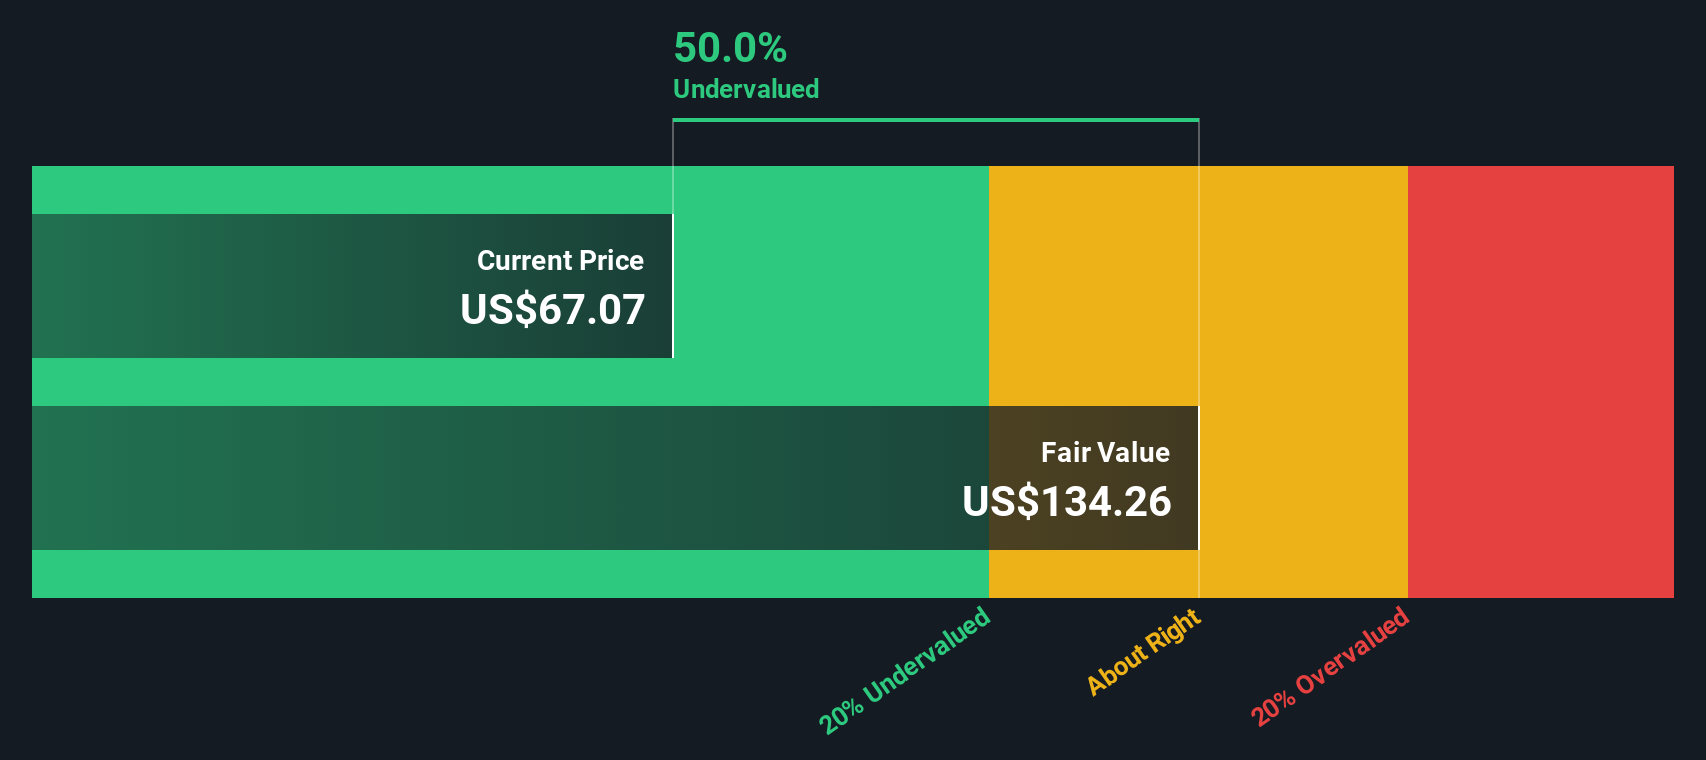
Approach 1: W. P. Carey Discounted Cash Flow (DCF) Analysis
The Discounted Cash Flow (DCF) model is a tool for estimating the intrinsic value of a company by projecting its future cash flows and discounting them back to today's dollars. For W. P. Carey, this model is based on adjusted funds from operations, capturing the company’s real estate cash generation power.
W. P. Carey’s most recent annual Free Cash Flow sits at $1.04 billion. Analyst estimates cover the next five years, forecasting steady growth, and projections are then extrapolated by Simply Wall St to provide a 10-year outlook. By 2028, Free Cash Flow is expected to reach $1.41 billion, with forecasts suggesting this figure could approach $2.03 billion by 2035.
According to these projections, the DCF model calculates an intrinsic value of $151.43 per share. Compared to the current share price, this suggests W. P. Carey may be undervalued by 56.4 percent if the forecasts prove to be accurate.
Result: UNDERVALUED
Our Discounted Cash Flow (DCF) analysis suggests W. P. Carey is undervalued by 56.4%. Track this in your watchlist or portfolio, or discover 832 more undervalued stocks based on cash flows.
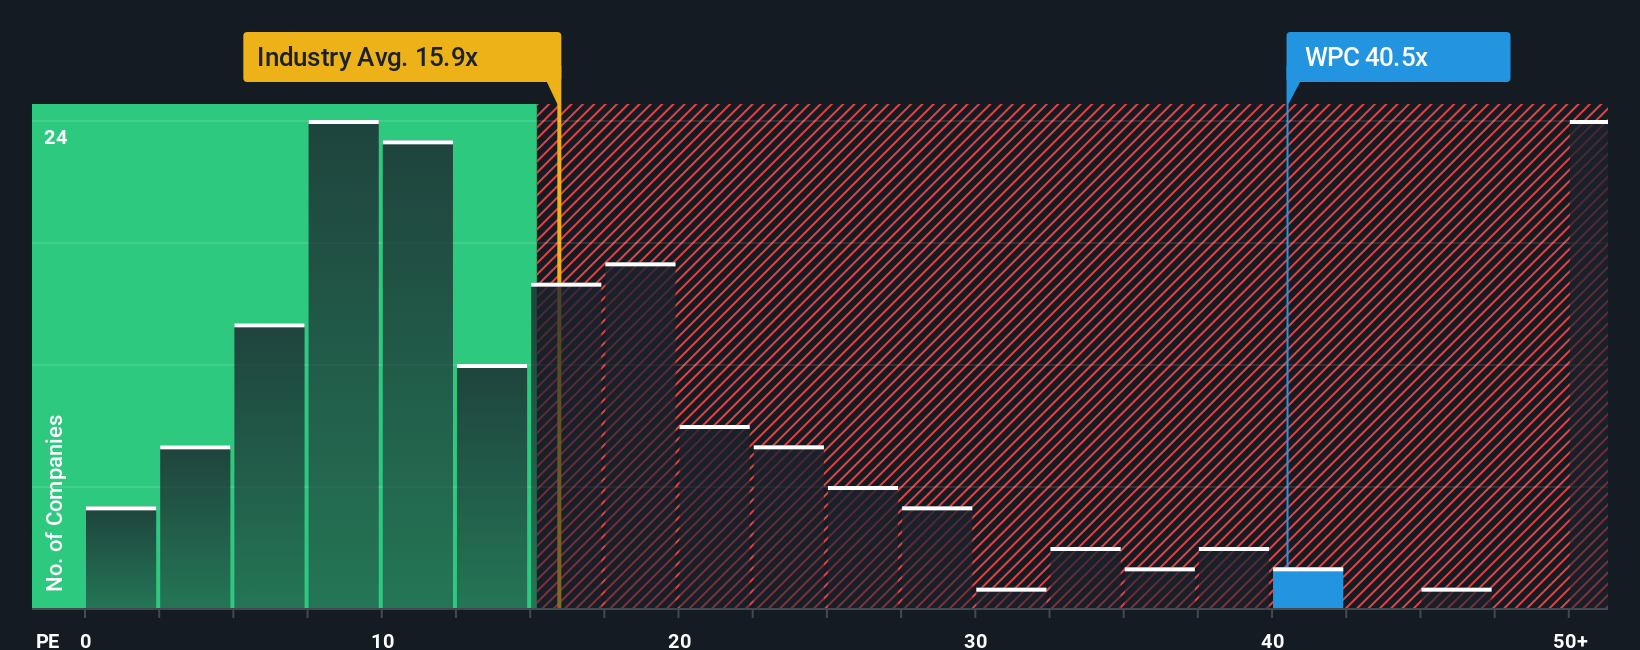
Approach 2: W. P. Carey Price vs Earnings
The price-to-earnings (PE) ratio is a widely used valuation metric, especially relevant for profitable companies like W. P. Carey. It allows investors to gauge how much they are paying for each dollar of earnings, which can be useful for comparing across businesses that already generate consistent profits.
However, what counts as a "normal" or "fair" PE ratio is not set in stone. Higher ratios can be justified if a company has strong growth prospects or lower risk, while slower growers or companies facing higher uncertainty deserve a discount. Context, including the company's earnings outlook and industry trends, really matters.
Right now, W. P. Carey trades at a PE ratio of 39.6x. This is well above the REITs industry average of 15.1x and also above the peer average at 28.3x. At first glance, this could make the stock look expensive compared to typical benchmarks.
To add more nuance, Simply Wall St calculates a Fair Ratio for each company by factoring in elements such as earnings growth, profit margins, risks, company size, and industry profile. For W. P. Carey, the Fair Ratio stands at 41.6x. This proprietary benchmark is designed to reflect what is truly reasonable to pay for a company with W. P. Carey's characteristics and is often more insightful than a straightforward comparison with industry or peer averages.
Given that W. P. Carey's current PE of 39.6x is just slightly below its Fair Ratio of 41.6x, the stock appears to be trading close to where it should be based on its fundamentals and outlook.
Result: ABOUT RIGHT
PE ratios tell one story, but what if the real opportunity lies elsewhere? Discover 1410 companies where insiders are betting big on explosive growth.
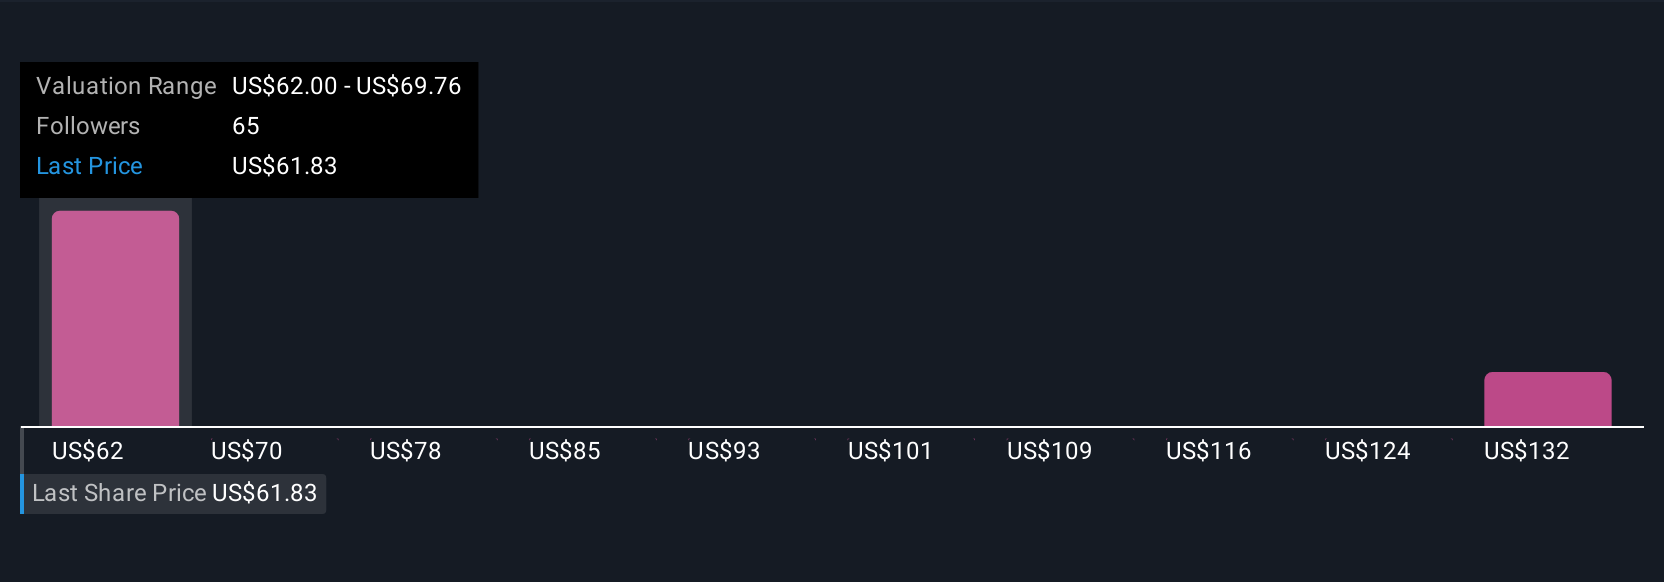
Upgrade Your Decision Making: Choose your W. P. Carey Narrative
Earlier we mentioned that there's an even better way to understand valuation, so let's introduce you to Narratives. A Narrative is your personalized story about a company, where you connect W. P. Carey's business strategy, future prospects, and risks to your own financial forecast and estimate of fair value.
By crafting a Narrative, you’re linking the company’s story to actual numbers, such as expected revenue, earnings, and profit margins. This process leads to a tailored view of what W. P. Carey is truly worth. Narratives are quick and accessible, available right within the Community page on Simply Wall St, where millions of investors share and update their perspectives.
This approach empowers you to make smarter buy or sell decisions by comparing your Fair Value against the current market Price, allowing you to spot opportunity or caution before others. Even better, Narratives stay current and change as news, earnings, and real-world events unfold, keeping your investment view relevant at all times.
For example, in the current community for W. P. Carey, some investors see upside, with fair values as high as $75, driven by optimism about e-commerce and logistics growth. Others are more cautious with values near $60, reflecting concerns about risk and sector headwinds. Narratives help you see these perspectives and decide which story you believe in.
Do you think there's more to the story for W. P. Carey? Head over to our Community to see what others are saying!
This article by Simply Wall St is general in nature. We provide commentary based on historical data and analyst forecasts only using an unbiased methodology and our articles are not intended to be financial advice. It does not constitute a recommendation to buy or sell any stock, and does not take account of your objectives, or your financial situation. We aim to bring you long-term focused analysis driven by fundamental data. Note that our analysis may not factor in the latest price-sensitive company announcements or qualitative material. Simply Wall St has no position in any stocks mentioned.
Have feedback on this article? Concerned about the content? Get in touch with us directly. Alternatively, email editorial-team@simplywallst.com