
Could DXC Technology’s 34.5% Drop Signal a Hidden Opportunity in 2025?
- Wondering if DXC Technology is a bargain right now? Let’s take a closer look beneath the headlines to see if this stock could be flying under the radar.
- Despite a rough patch, shares have dropped 3.2% in the past week, are down 5.1% over the past month, and have fallen an eye-catching 34.5% so far this year. Investors are curious if this signals greater risk or uncovers an opportunity.
- These declines follow several headlines about DXC Technology’s ongoing strategic shifts and industry partnerships, both of which have stirred up speculation about the company’s future direction. Significant organizational changes and sector trends have added more complexity to the story, fueling both skepticism and hope in the market.
- Right now, DXC Technology scores a 5 out of 6 on our undervaluation checks. This suggests real value potential, but there’s more to valuation than just the numbers. Stick around as we break down the standard valuation approaches, and be on the lookout for an even more insightful way to get the full valuation picture at the end.
Find out why DXC Technology's -34.8% return over the last year is lagging behind its peers.
Approach 1: DXC Technology Discounted Cash Flow (DCF) Analysis
A Discounted Cash Flow (DCF) model estimates a company's intrinsic value by projecting its anticipated future cash flows and discounting them back to their present value. This approach aims to reveal what a business is really worth today, based solely on its ability to generate cash in the future.
DXC Technology’s current Free Cash Flow sits at approximately $909.5 Million. Analysts provide direct projections for the next five years, and thereafter, Simply Wall St extrapolates further using reasonable industry estimates. By 2027, forecasted Free Cash Flow is around $650.43 Million, with a ten-year projection pointing to roughly $514.09 Million by 2035. Despite a moderate decline over time, these numbers show a steady cash-generating foundation.
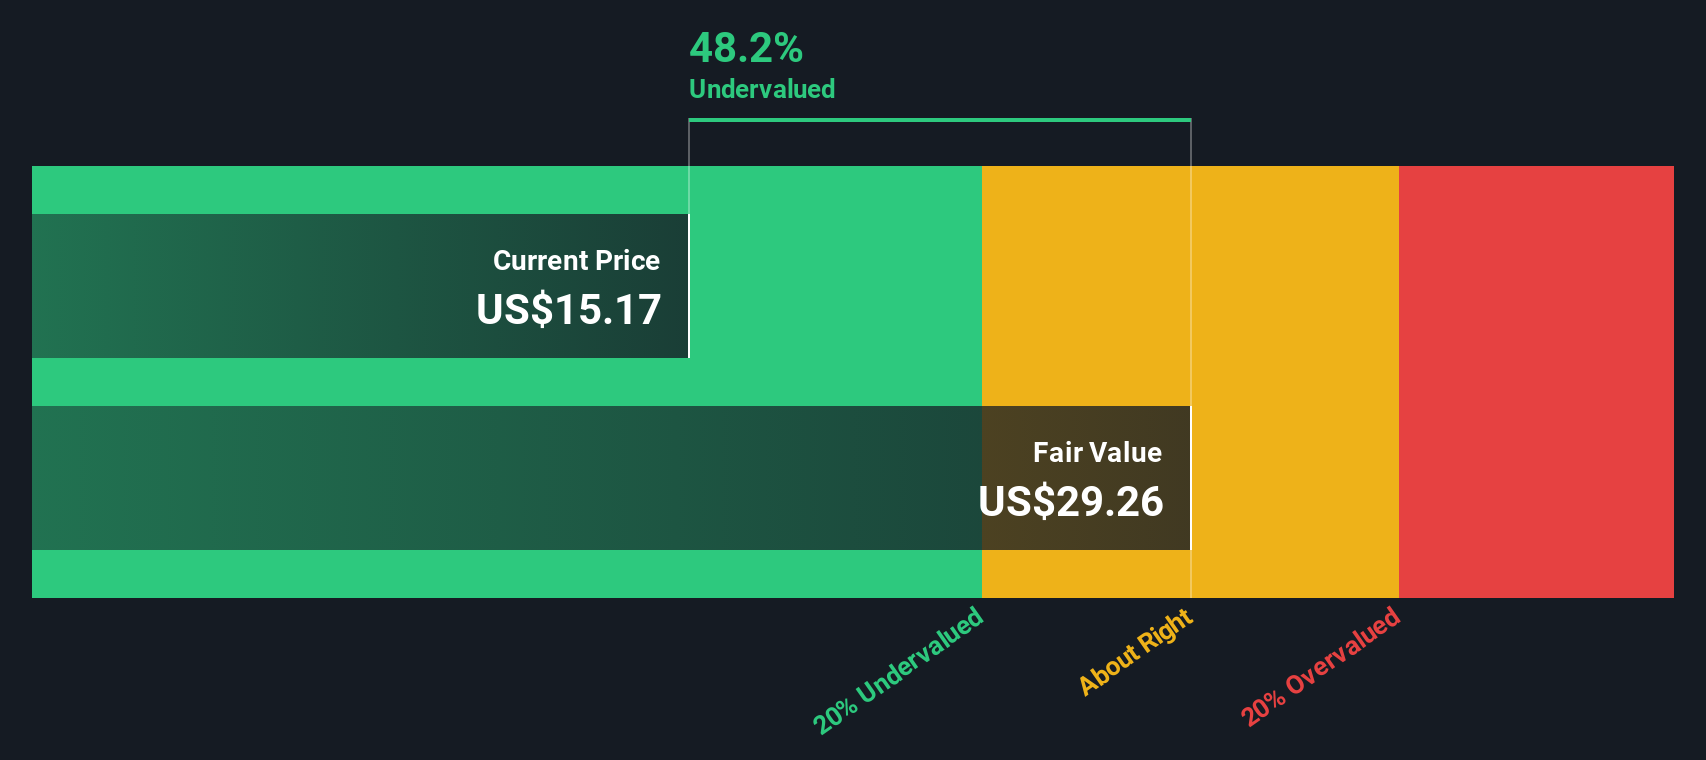
According to the DCF model using these cash flow estimates, the fair value per share comes out to $27.43. This is 52.8% higher than the current share price. This suggests the stock is significantly undervalued by the market.
Result: UNDERVALUED
Our Discounted Cash Flow (DCF) analysis suggests DXC Technology is undervalued by 52.8%. Track this in your watchlist or portfolio, or discover 848 more undervalued stocks based on cash flows.
Approach 2: DXC Technology Price vs Earnings
For established, profitable companies like DXC Technology, the Price-to-Earnings (PE) ratio is a widely used and effective valuation metric. Since it compares a company’s current share price against its earnings per share, the PE ratio gives investors a quick sense of how the market is valuing its profitability.
Of course, what qualifies as a “normal” or “fair” PE ratio depends on several factors. Companies with faster earnings growth or lower risk typically deserve higher PE ratios, while those facing slower growth or more uncertainty tend to trade on lower multiples.
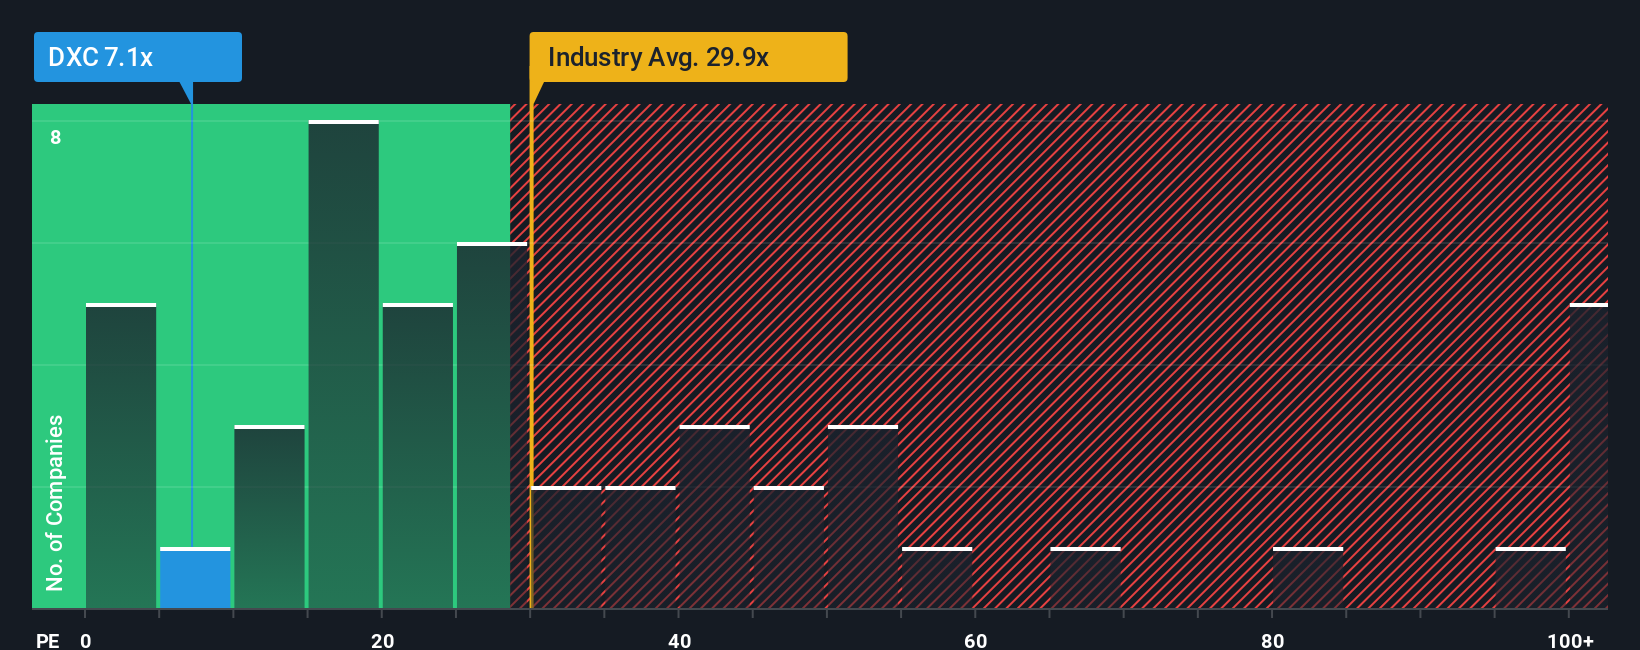
DXC Technology currently trades at a PE ratio of just 6.1x. This stands out sharply against the Information Technology industry average of 29.3x and the average among direct peers at 20.7x. Such a discount hints that investors may have concerns, but it could also point to untapped value.
Simply Wall St’s proprietary “Fair Ratio” for DXC Technology is 18.7x. The Fair Ratio is calculated with a more holistic view than just industry or peer averages. It factors in the company’s unique risk profile, growth prospects, profit margins, and market capitalization, offering a more comprehensive indication of a reasonable valuation multiple for this business specifically.
When we compare DXC Technology’s actual PE of 6.1x to its Fair Ratio of 18.7x, the shares look strongly undervalued in a multiple-based evaluation.
Result: UNDERVALUED
PE ratios tell one story, but what if the real opportunity lies elsewhere? Discover 1405 companies where insiders are betting big on explosive growth.
Upgrade Your Decision Making: Choose your DXC Technology Narrative
Earlier we mentioned that there is an even better way to understand valuation, so let’s introduce you to Narratives. A Narrative is your personalized investment story, where you combine your outlook on a company, such as its future revenue, earnings, and margins, with what you believe to be its fair value based on your own reasoning or research.
Narratives bridge the gap between stories and spreadsheets, linking your perspective about DXC Technology’s business prospects directly to a financial forecast and a resulting fair value estimate. Best of all, Narratives are designed to be easy to use and are available for everyone on Simply Wall St's Community page, where millions of investors share their views.
With Narratives, you can quickly determine whether now might be a good time to buy or sell by comparing your Fair Value to the current Price, helping you make decisions based on your specific expectations rather than just the market consensus or analyst targets.
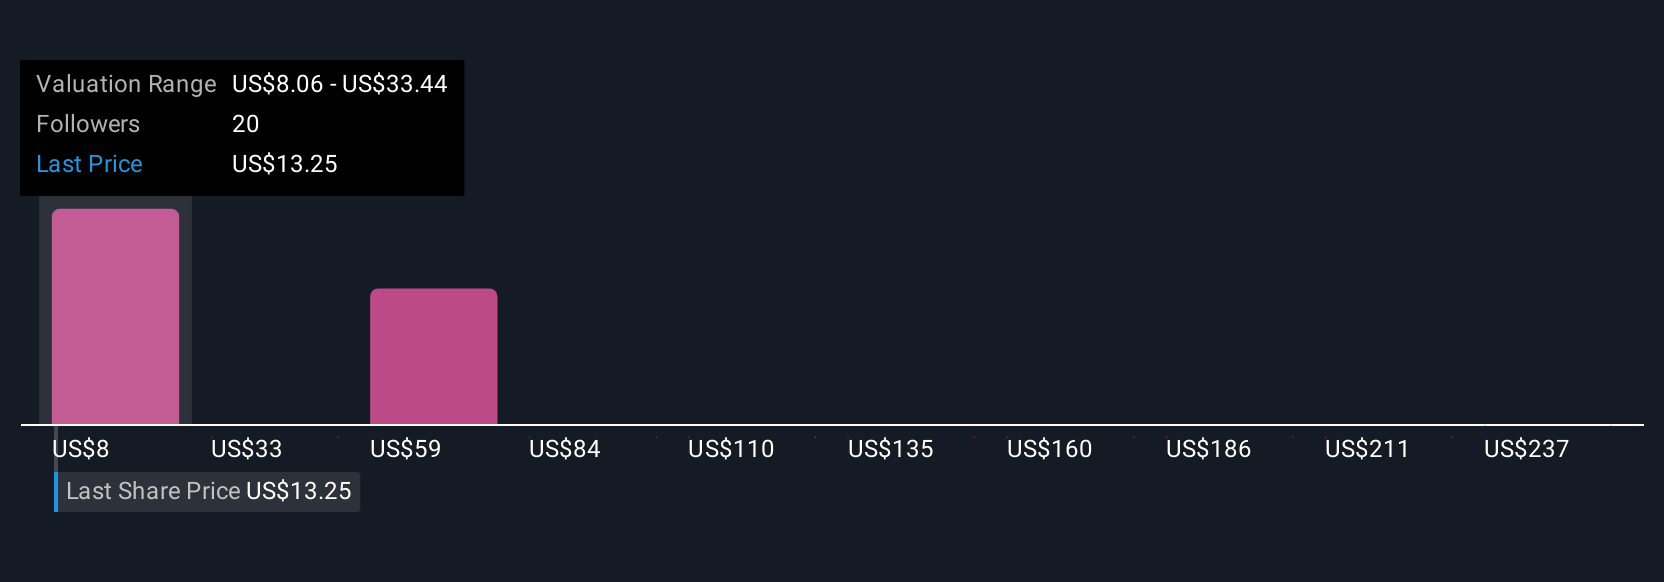
Because Narratives update automatically when new news or earnings reports are released, your investment thesis stays fresh and relevant as the situation changes. For example, some investors see strong AI and cloud partnerships as reasons to assign a fair value of $18.00 per share, while cautious investors note ongoing revenue declines and set their fair value at just $14.00. This demonstrates how Narrative tools empower you to act on the view that fits you best.
Do you think there's more to the story for DXC Technology? Head over to our Community to see what others are saying!
This article by Simply Wall St is general in nature. We provide commentary based on historical data and analyst forecasts only using an unbiased methodology and our articles are not intended to be financial advice. It does not constitute a recommendation to buy or sell any stock, and does not take account of your objectives, or your financial situation. We aim to bring you long-term focused analysis driven by fundamental data. Note that our analysis may not factor in the latest price-sensitive company announcements or qualitative material. Simply Wall St has no position in any stocks mentioned.
Have feedback on this article? Concerned about the content? Get in touch with us directly. Alternatively, email editorial-team@simplywallst.com