
How Oracle’s AI and Cloud Push Impacts Its 2025 Share Price and Valuation
If you’re watching Oracle’s stock and trying to decide what your next move should be, you’re not alone. Over the past year, Oracle’s shares have posted a jaw-dropping 63.5% gain, and if you zoom out even further, the five-year return stands at a staggering 430.1%. It’s enough to make anyone take a pause before hitting buy or sell. Yet, despite those blistering long-term gains, the stock has shown some choppiness lately, slipping 0.9% over the past month after a recent climb of 2.1% this week. Year-to-date, though, Oracle remains firmly in growth territory, up a massive 69.1% since January.
What is the story behind these moves? Recent headlines point to Oracle’s aggressive push into artificial intelligence and cloud computing partnerships, which has triggered renewed optimism from investors who see the company as a key player in enterprise tech’s next wave. Even so, there have been hints of caution from the market as Oracle navigates increasingly competitive waters, and big gains often prompt investors to lock in profits and reassess the risk.
With the current value score sitting at 1 out of 6 on our valuation check, it is clear that most methods do not flag Oracle as significantly undervalued at this moment. But as any seasoned investor knows, there is more to the story than a single score. Let’s break down exactly how Oracle stacks up across different valuation methods. Stick around, because there is an even more insightful way to look at valuation that we will get to at the end.
Oracle scores just 1/6 on our valuation checks. See what other red flags we found in the full valuation breakdown.
Approach 1: Oracle Discounted Cash Flow (DCF) Analysis
The Discounted Cash Flow (DCF) model estimates a company's intrinsic value by projecting future free cash flows and discounting them back to today's value. This approach aims to capture the true worth of Oracle by examining how much cash the business is expected to generate over time and then determining what those future cash flows are worth in today’s dollars.
Currently, Oracle’s latest twelve month Free Cash Flow stands at approximately $5.84 billion. Analyst forecasts suggest Oracle’s Free Cash Flow could swing significantly over the coming years, eventually rising to an extrapolated $68.24 billion in 2035. For context, the first five years rely on direct analyst estimates. Projections further out are extended by Simply Wall St, providing a broader long-term view. Altogether, these figures are combined and discounted to reflect their present value in US dollars.
By running the numbers through a 2 Stage Free Cash Flow to Equity model, Oracle’s DCF-based intrinsic value comes out at $226.93 per share. However, with the current share price trading about 23.8% above this estimate, the model suggests the stock is overvalued at present levels.
Result: OVERVALUED
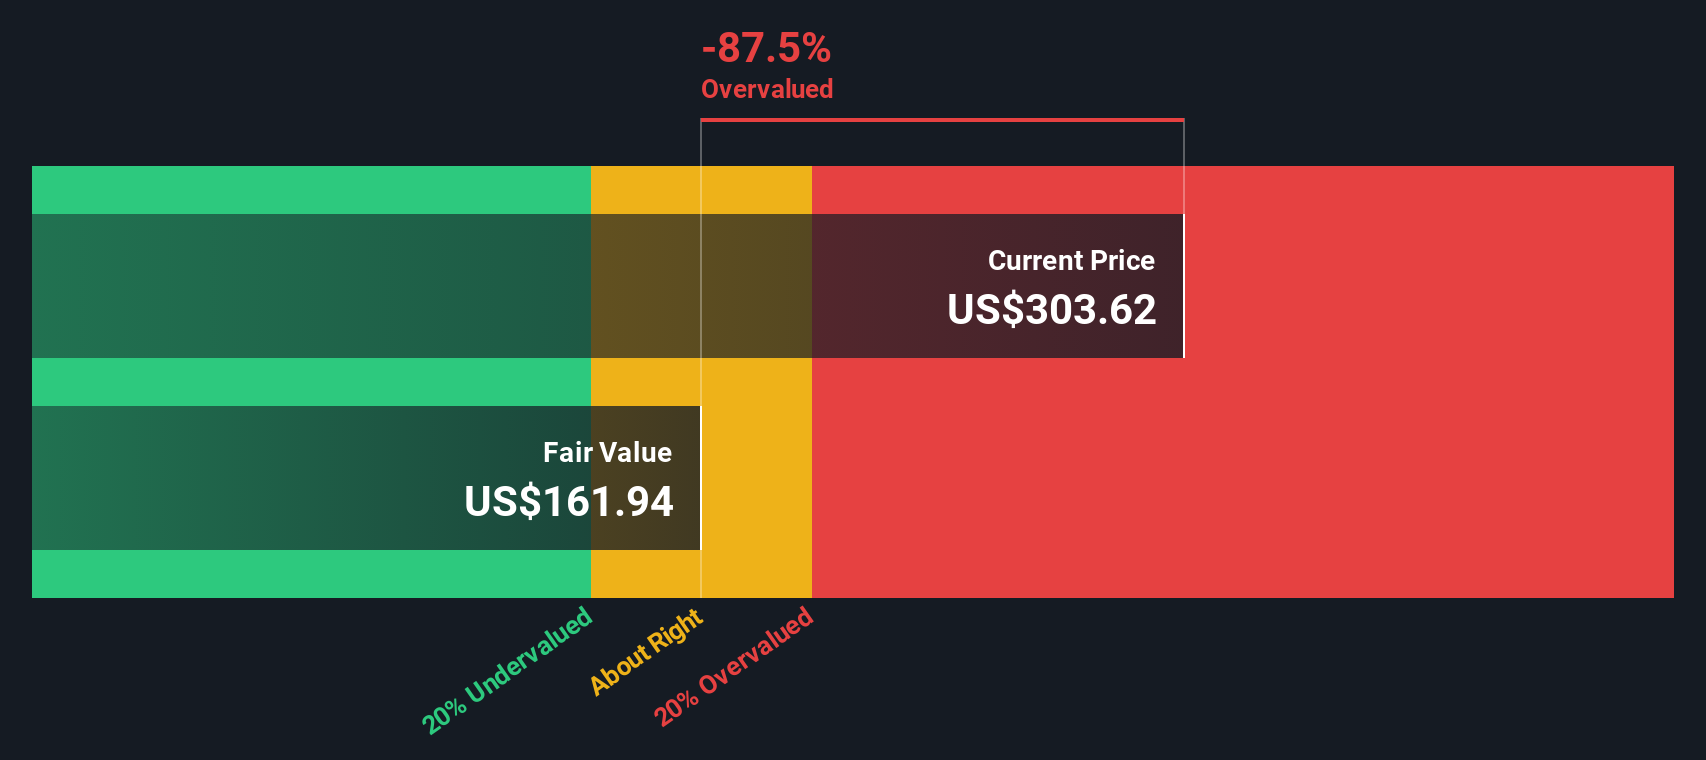
Our Discounted Cash Flow (DCF) analysis suggests Oracle may be overvalued by 23.8%. Find undervalued stocks or create your own screener to find better value opportunities.
Approach 2: Oracle Price vs Earnings
For a profitable business like Oracle, the Price-to-Earnings (PE) ratio is a tried-and-tested way to gauge valuation. Because the PE ratio compares a company’s stock price to its earnings, it can reveal how much investors are willing to pay for each dollar of profit. This makes it especially relevant for established companies consistently generating profits.
The “right” or “normal” PE ratio is not set in stone. It often depends on how quickly a company is growing, how volatile or risky its earnings are, and how it compares to industry peers. Higher expected growth or lower risk can justify a higher PE ratio, while the opposite is also true.
Currently, Oracle trades at a PE of 64.35x, which is much higher than the Software industry average of 34.25x and slightly below the peer group average of 80.71x. Instead of just benchmarking against peers or the industry, the Simply Wall St “Fair Ratio” uses a model that factors in Oracle’s specific earnings growth, margins, size, and risk, along with the broader industry landscape. This makes it a more tailored and informative benchmark than using a one-size-fits-all average.
Simply Wall St’s Fair Ratio for Oracle is 62.67x, which is very close to the company’s actual PE of 64.35x. This suggests that, after accounting for growth and risk, the market is pricing Oracle about where it should be at present.
Result: ABOUT RIGHT
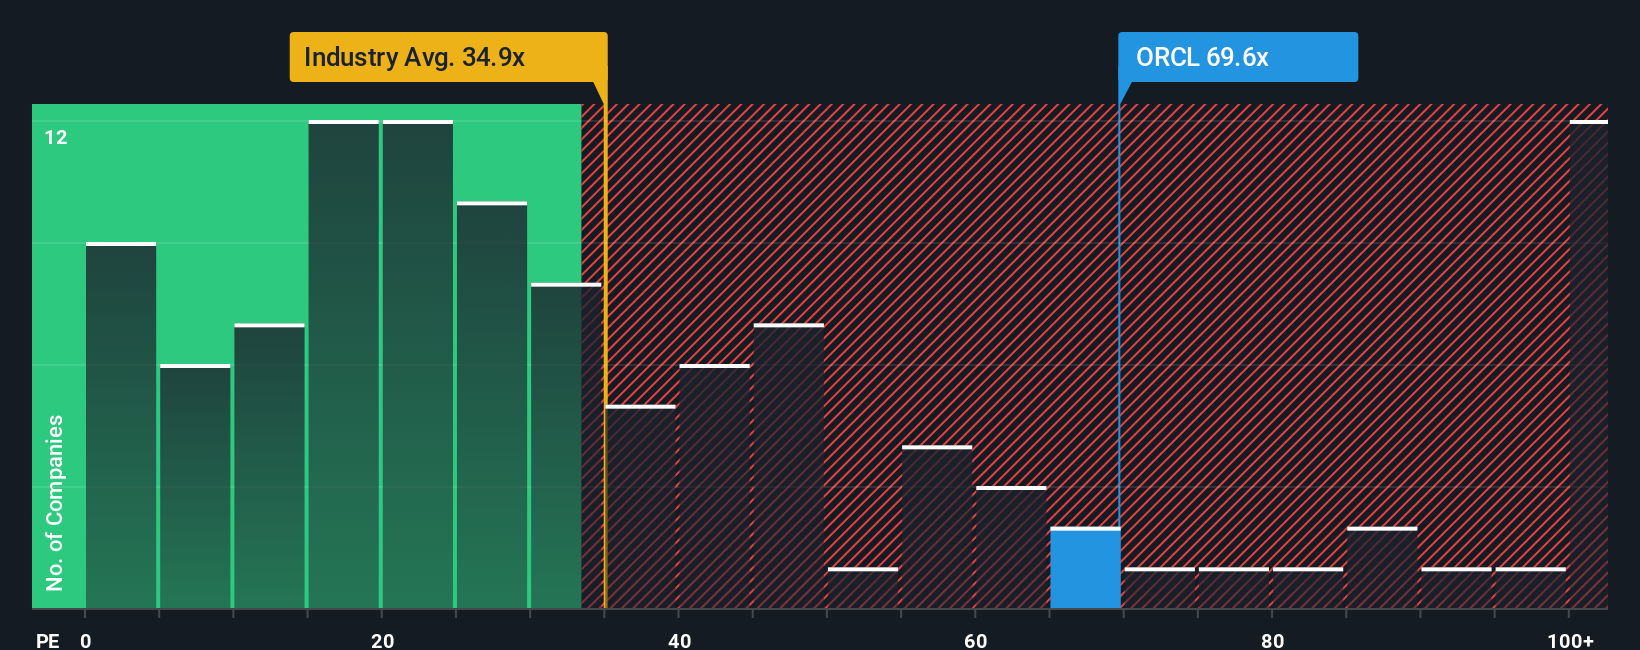
PE ratios tell one story, but what if the real opportunity lies elsewhere? Discover companies where insiders are betting big on explosive growth.
Upgrade Your Decision Making: Choose your Oracle Narrative
Earlier we mentioned that there is an even better way to understand valuation, so let’s introduce you to Narratives. A Narrative is simply your story, your perspective about a company’s future, which you connect to real numbers like estimated fair value, future revenue, earnings, and profit margins.
Unlike traditional methods that only rely on numbers, Narratives help you link Oracle’s business story (for example, “Oracle is becoming a cloud-first, AI-driven leader”) directly to your forecasts and the company’s fair value. This holistic approach makes your investment decisions both more informed and personal.
Narratives are easy to use and instantly accessible to investors on the Simply Wall St Community page, a platform trusted by millions. They let you quickly compare your fair value estimate with Oracle’s current share price to decide whether to buy or sell. Because Narratives are updated automatically as new news or earnings are released, your view always stays relevant.
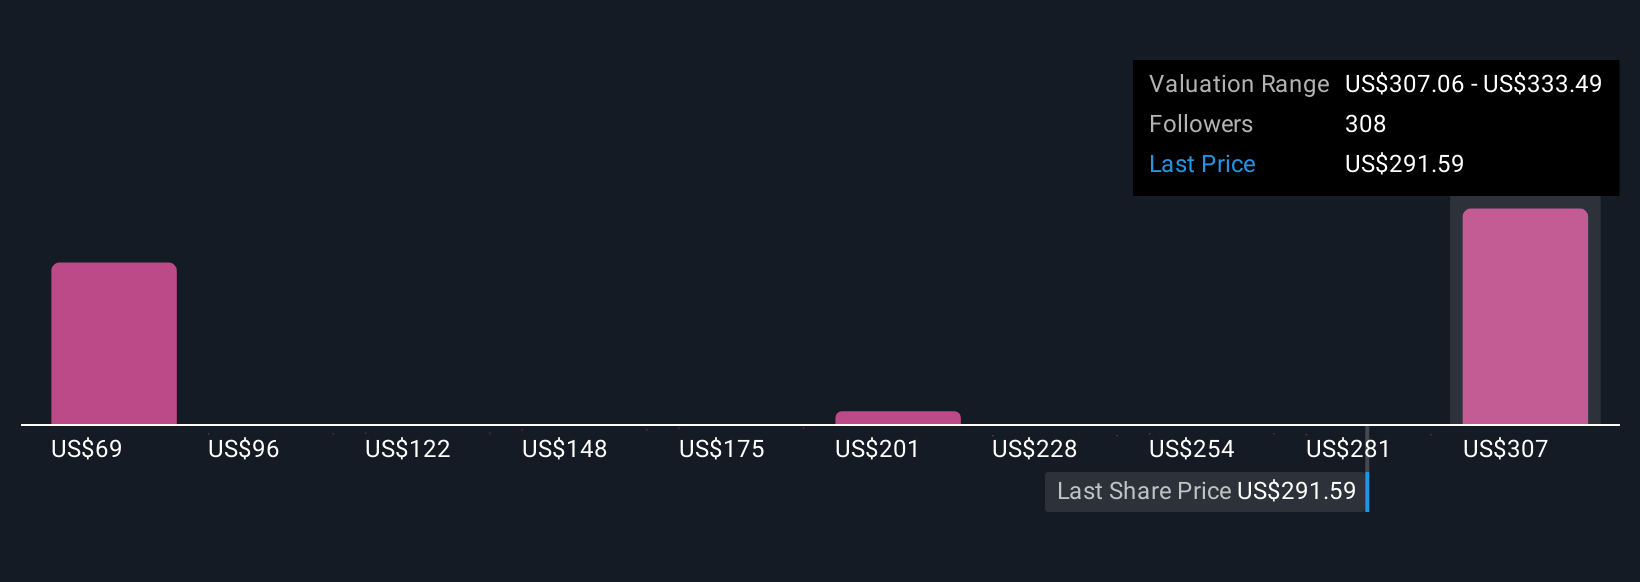
For example, investors who believe in strong AI-driven growth for Oracle are forecasting a fair value as high as $344 per share, while those more cautious about cloud competition set their fair value closer to $212. Narratives let you see exactly why different investors set different targets and make it simple for you to benchmark your own story against the market.
For Oracle, we will make it really easy for you with previews of two leading Oracle Narratives:
- 🐂 Oracle Bull Case
Fair Value: $344.07
Oracle is currently trading at approximately 18.4% below this estimated fair value.
Revenue Growth Forecast: 32.57%
- Strong enterprise demand for AI workloads and unique AI-integrated offerings are accelerating Oracle’s cloud revenue and driving higher enterprise adoption.
- Efficient migration of database customers to Oracle Cloud and robust multi-year backlog increase revenue stability, visibility, and operating margin improvement.
- Key risks include dependence on large AI infrastructure demand, elevated CapEx, and the potential for increased competition and margin compression as AI and cloud markets mature.
- 🐻 Oracle Bear Case
Fair Value: $212.00
Oracle is currently trading at approximately 32.4% above this estimated fair value.
Revenue Growth Forecast: 14.39%
- Oracle’s transformation to a cloud-first, AI-driven enterprise IT leader is underway, focusing on growth in cloud services, AI integration, and industry-specific solutions.
- Risks include intense competition from major cloud providers, execution challenges in scaling, and financial constraints created by debt and economic downturns.
- Oracle’s long-term growth relies on successful execution in cloud and AI while maintaining operational efficiency and financial discipline amid ongoing challenges.
Do you think there's more to the story for Oracle? Create your own Narrative to let the Community know!
This article by Simply Wall St is general in nature. We provide commentary based on historical data and analyst forecasts only using an unbiased methodology and our articles are not intended to be financial advice. It does not constitute a recommendation to buy or sell any stock, and does not take account of your objectives, or your financial situation. We aim to bring you long-term focused analysis driven by fundamental data. Note that our analysis may not factor in the latest price-sensitive company announcements or qualitative material. Simply Wall St has no position in any stocks mentioned.
Have feedback on this article? Concerned about the content? Get in touch with us directly. Alternatively, email editorial-team@simplywallst.com