
What Does BP’s Recent 5.8% Rally Mean for Its True Value in 2025?
If you have BP stock or are considering it for your portfolio, you are probably evaluating your next move. BP's share price has experienced notable movement recently, with a 5.8% increase in the past week, even though it declined 2.4% over the past month. Year-to-date, it has achieved a 7.9% gain, and the one-year return stands at 14.1%. Looking further back, the five-year return reaches 185.4%. These figures tend to draw attention, whether you are a long-term holder or a newcomer.
Growth stories like these do not happen in isolation. Recent headlines about BP, from its ongoing investments in renewable energy to changes in global oil dynamics, have influenced how investors assess the stock’s risk and reward. Investors now see BP not just as a company with traditional energy assets, but also as one shifting toward a more balanced and forward-looking profile. This evolving narrative helps explain why some anticipate further gains while others expect a more challenging road ahead.
So, what is BP’s stock truly worth today? Using six widely used valuation checks, BP scores 5 out of 6, suggesting that it appears undervalued by most traditional measures. In the next section, we will break down each of these valuation approaches so you can see how they apply to BP. For those looking for a clearer approach to stock valuation, continue reading for a different perspective that might surprise you.
Why BP is lagging behind its peers
Approach 1: BP Discounted Cash Flow (DCF) Analysis
The Discounted Cash Flow (DCF) model estimates a company's true value by projecting its future cash flows and then discounting them back to today's dollars. This approach helps investors understand whether a stock is trading above or below its intrinsic value based on expected financial performance.
For BP, the latest reported Free Cash Flow (FCF) stands at $10.3 billion. Analysts have provided forecasts for the next five years, with expectations of $10.1 billion in 2026 and $9.8 billion by 2029. Projections beyond that are extrapolated and suggest a fairly stable FCF, with gradual growth continuing over the next decade. These numbers are calculated using a 2 Stage Free Cash Flow to Equity model, which ensures that both near-term and long-term perspectives are considered.
Based on these discounted cash flow estimates, BP's intrinsic value comes out to $7.69 per share. Compared to the current share price, the DCF model implies BP is trading at a 43.4% discount. This suggests the stock is significantly undervalued by traditional DCF standards.
Result: UNDERVALUED
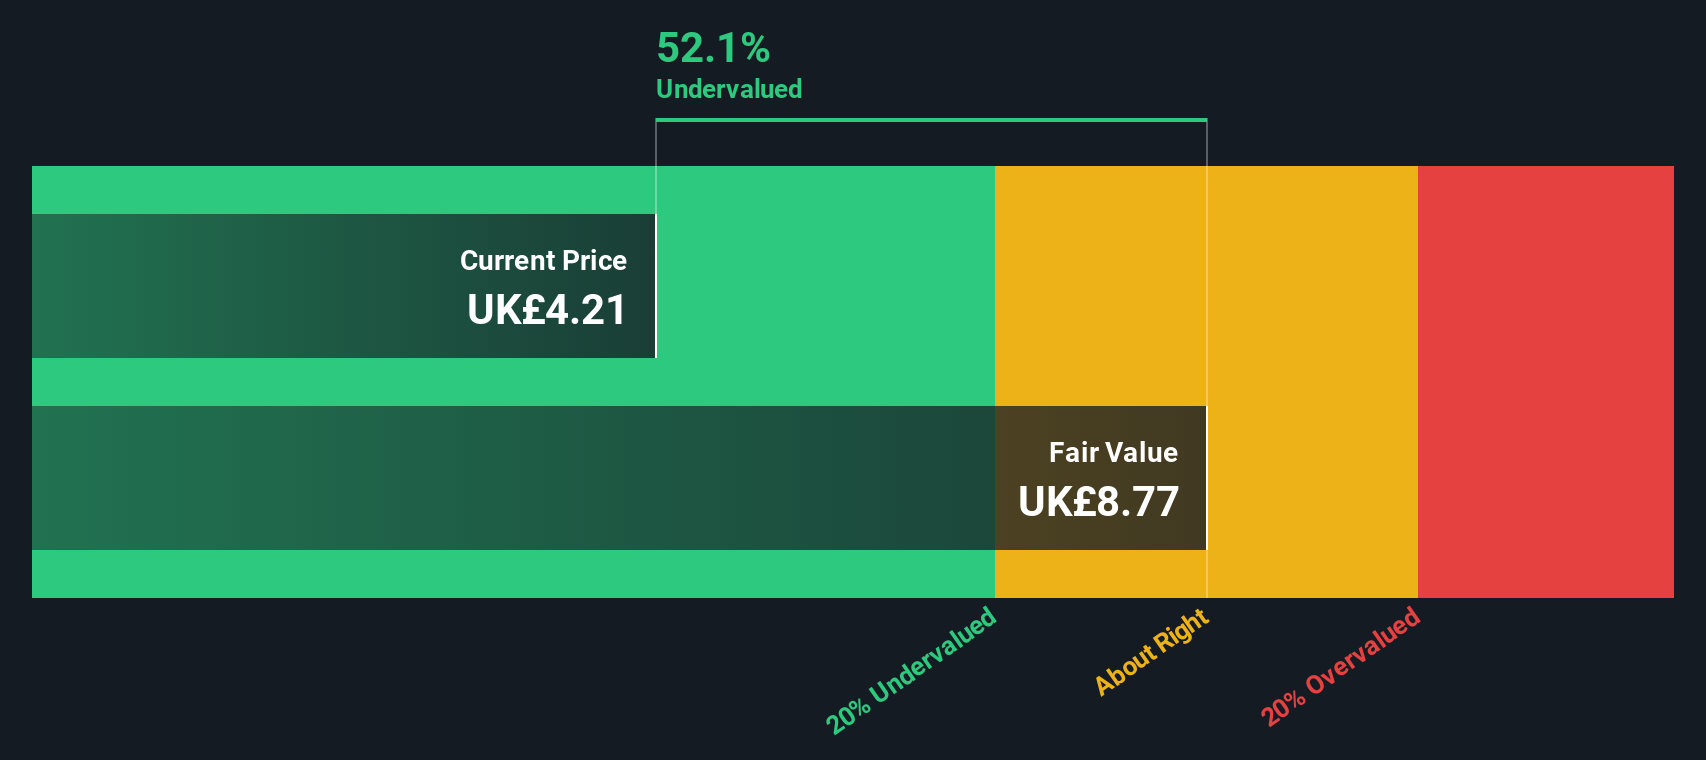
Our Discounted Cash Flow (DCF) analysis suggests BP is undervalued by 43.4%. Track this in your watchlist or portfolio, or discover more undervalued stocks.
Approach 2: BP Price vs Sales
The Price-to-Sales (P/S) ratio is a widely used valuation metric, particularly suitable for evaluating established, profitable companies in industries like oil and gas. It allows investors to gauge how much the market is willing to pay for each dollar of sales. This is a useful standard when comparing companies with varying profit levels, capital expenditures, or cyclical earnings.
Market expectations for growth and risk play an important role in what is considered a "fair" P/S ratio. Higher expected sales growth or lower perceived risk typically justifies a higher multiple, while slower growth or elevated risk usually leads to a lower one. Benchmarks such as the industry average and peer companies help to put BP's valuation in context.
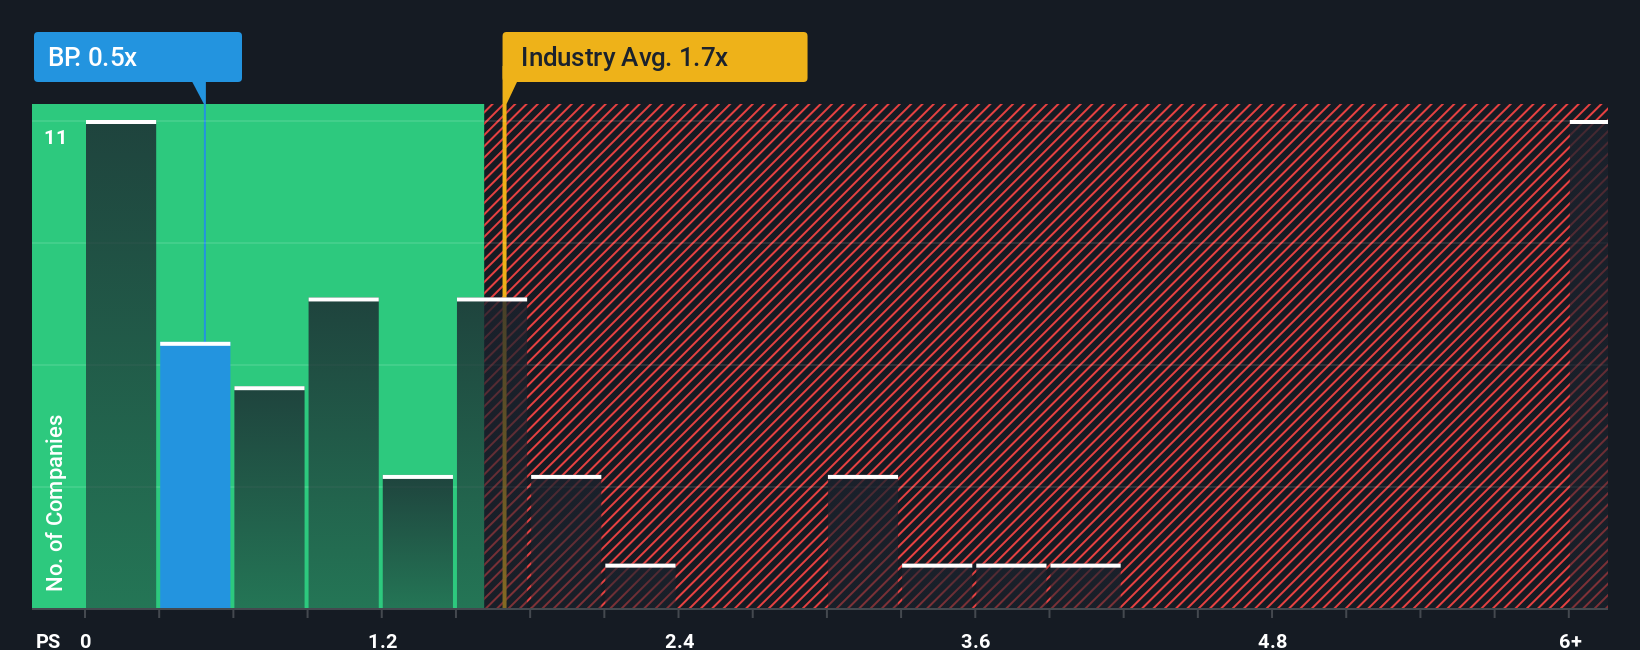
BP currently trades at a P/S ratio of 0.48x. By comparison, the peer average is 1.70x and the oil and gas industry as a whole averages 1.78x. While these numbers suggest BP is priced well below both its industry and direct competitors, there is an additional benchmark to consider: Simply Wall St's proprietary Fair Ratio. This Fair Ratio for BP is 1.34x, which represents what the stock should be trading at based on a blend of its projected growth, risk factors, industry profile, profit margins, and market cap. The Fair Ratio is a more robust measure than simple peer or industry averages because it accounts for company-specific fundamentals beyond broad sector trends.
Compared with its Fair Ratio of 1.34x, BP’s current P/S multiple of 0.48x implies the stock is significantly undervalued on this metric, even after considering its business risks and growth outlook.
Result: UNDERVALUED
PS ratios tell one story, but what if the real opportunity lies elsewhere? Discover companies where insiders are betting big on explosive growth.
Upgrade Your Decision Making: Choose your BP Narrative
Earlier we mentioned that there is an even better way to understand valuation, so let’s introduce you to Narratives. A Narrative is simply your story about a company: the logic, forecasts, and expectations that guide how you see its future. Beyond just crunching numbers, Narratives let you express your own perspective by connecting BP’s business story to your financial forecasts and arriving at what you believe is a fair value.
Narratives make investing more accessible by helping you link real-world news, company strategy, and financial projections all in one place. On Simply Wall St’s Community page, used by millions of investors, Narratives allow you to test your thesis for BP, see if your fair value is above or below the current price, and quickly decide if you think the stock is a buy, sell, or hold. They update automatically as new information like results or news emerges, so your view always stays relevant.
For example, an optimistic Narrative for BP might expect fast earnings growth and margin expansion, concluding that the stock is deeply undervalued. A more cautious Narrative could focus on transition risks, leading to a lower fair value and a less bullish outlook. Narratives put you in control, letting you invest with greater clarity and confidence.
Do you think there's more to the story for BP? Create your own Narrative to let the Community know!
This article by Simply Wall St is general in nature. We provide commentary based on historical data and analyst forecasts only using an unbiased methodology and our articles are not intended to be financial advice. It does not constitute a recommendation to buy or sell any stock, and does not take account of your objectives, or your financial situation. We aim to bring you long-term focused analysis driven by fundamental data. Note that our analysis may not factor in the latest price-sensitive company announcements or qualitative material. Simply Wall St has no position in any stocks mentioned.
Have feedback on this article? Concerned about the content? Get in touch with us directly. Alternatively, email editorial-team@simplywallst.com