
Should You Revisit Coca-Cola Stock After Its 12.7% Surge in 2025?
Are you weighing your options on Coca-Cola stock? You are not alone. Whether you are a longtime shareholder, a steady dividend lover, or someone eyeing a reliable blue-chip opportunity, Coca-Cola has probably been on your radar. The stock’s reputation for stability has made it a popular pick, but recent trading action deserves a closer look, especially for anyone trying to decide if this is the moment to buy, hold, or trim their position.
In the past week alone, Coca-Cola shares have ticked up 1.9%, and over the last 30 days they have climbed 4.9%. That solid momentum is even more impressive when you consider the stock's 12.7% return so far this year, outpacing many peers in the consumer staples sector. Zooming out, a 5-year return of 68.7% tells the story of enduring growth, which is largely credited to the company’s global brand strength and its ability to adapt to changing consumer tastes.
Industry watchers have attributed some of the recent stock movement to news around product innovation and sustainability initiatives, both of which support Coca-Cola’s ability to maintain growth in developed markets and find new avenues in emerging economies. This sense of optimism appears to have contributed to a shift in risk perceptions among investors, making the stock even more attractive to some.
Of course, headline moves and positive sentiment only get you so far. What really matters is value. Our latest valuation breakdown scores Coca-Cola a 4 out of 6, meaning it appears undervalued on two-thirds of our key measures. But how does that score stack up against other approaches, and is there an even better way to get a real sense of value? That is exactly where we are headed next.
Approach 1: Coca-Cola Discounted Cash Flow (DCF) Analysis
A Discounted Cash Flow (DCF) model estimates a company's value by projecting its future cash flows and discounting those amounts back to today's value. For Coca-Cola, the DCF analysis uses a 2 Stage Free Cash Flow to Equity model, which helps capture both near-term analyst projections and longer-term estimates.
Currently, Coca-Cola is generating free cash flow of approximately $5.6 Billion. Based on analyst forecasts and longer-term extrapolation, these annual cash flows are expected to grow noticeably, reaching as much as $19.3 Billion by 2035, with $15.2 Billion projected in 2029. This positive growth trajectory highlights Coca-Cola’s robust financial health and ongoing ability to generate substantial cash.
Applying this DCF model, the estimated intrinsic value for Coca-Cola stock comes out to $90.61 per share. This figure is roughly 23.1% higher than recent trading prices, suggesting the stock is currently undervalued based on this cash flow-driven approach.
Result: UNDERVALUED
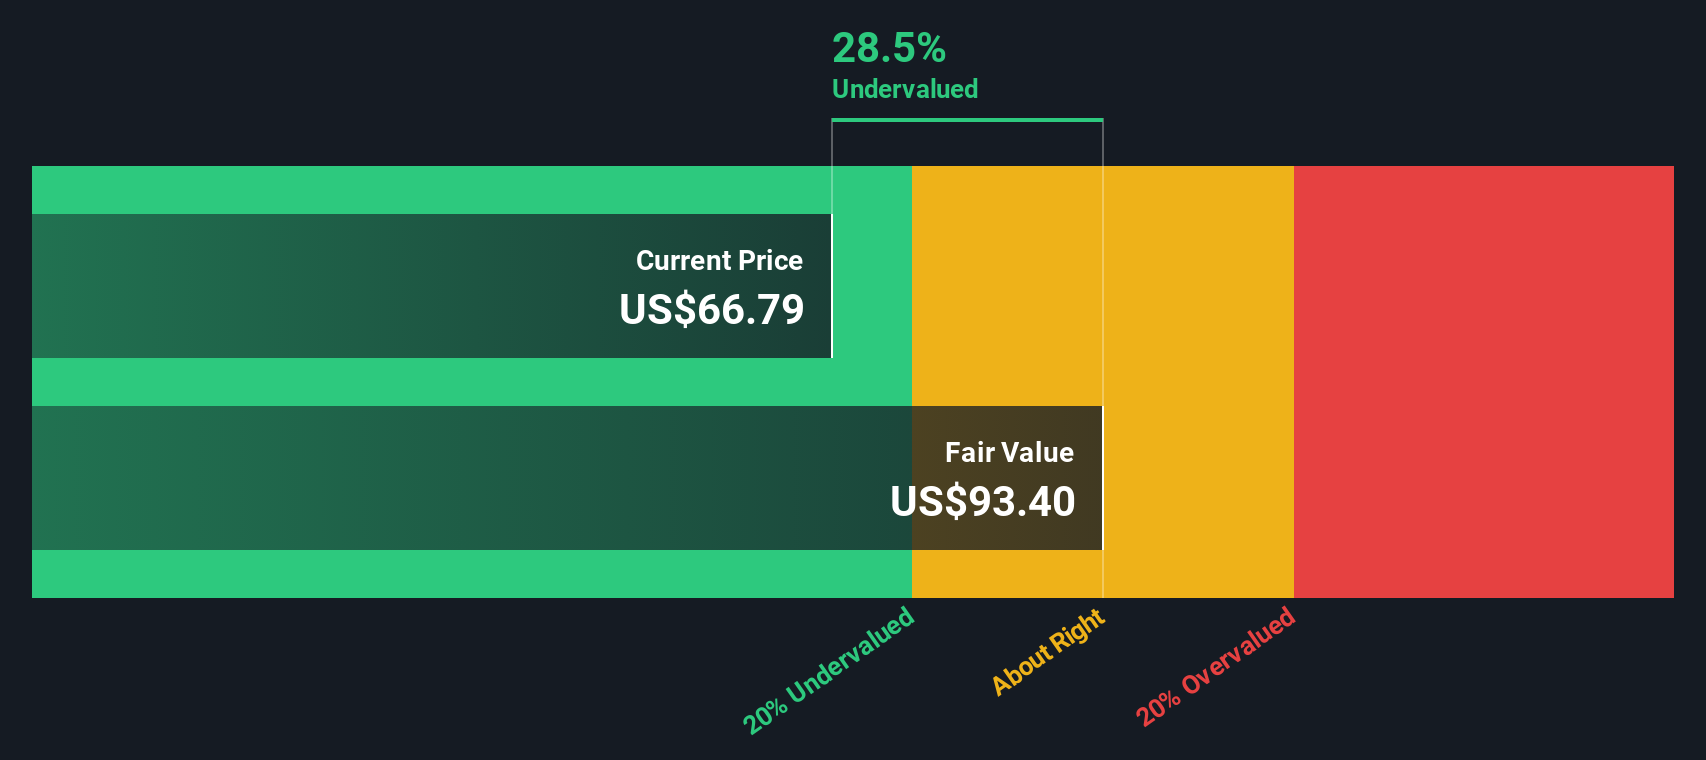
Our Discounted Cash Flow (DCF) analysis suggests Coca-Cola is undervalued by 23.1%. Track this in your watchlist or portfolio, or discover more undervalued stocks.
Approach 2: Coca-Cola Price vs Earnings
For companies with consistent profitability, such as Coca-Cola, the Price-to-Earnings (PE) ratio is a trusted valuation metric. It helps investors quickly assess whether a stock’s price is reasonable relative to its earnings power. A higher PE ratio generally reflects higher market expectations for future growth, lower perceived risks, or both. A lower PE signals less optimism or greater caution.
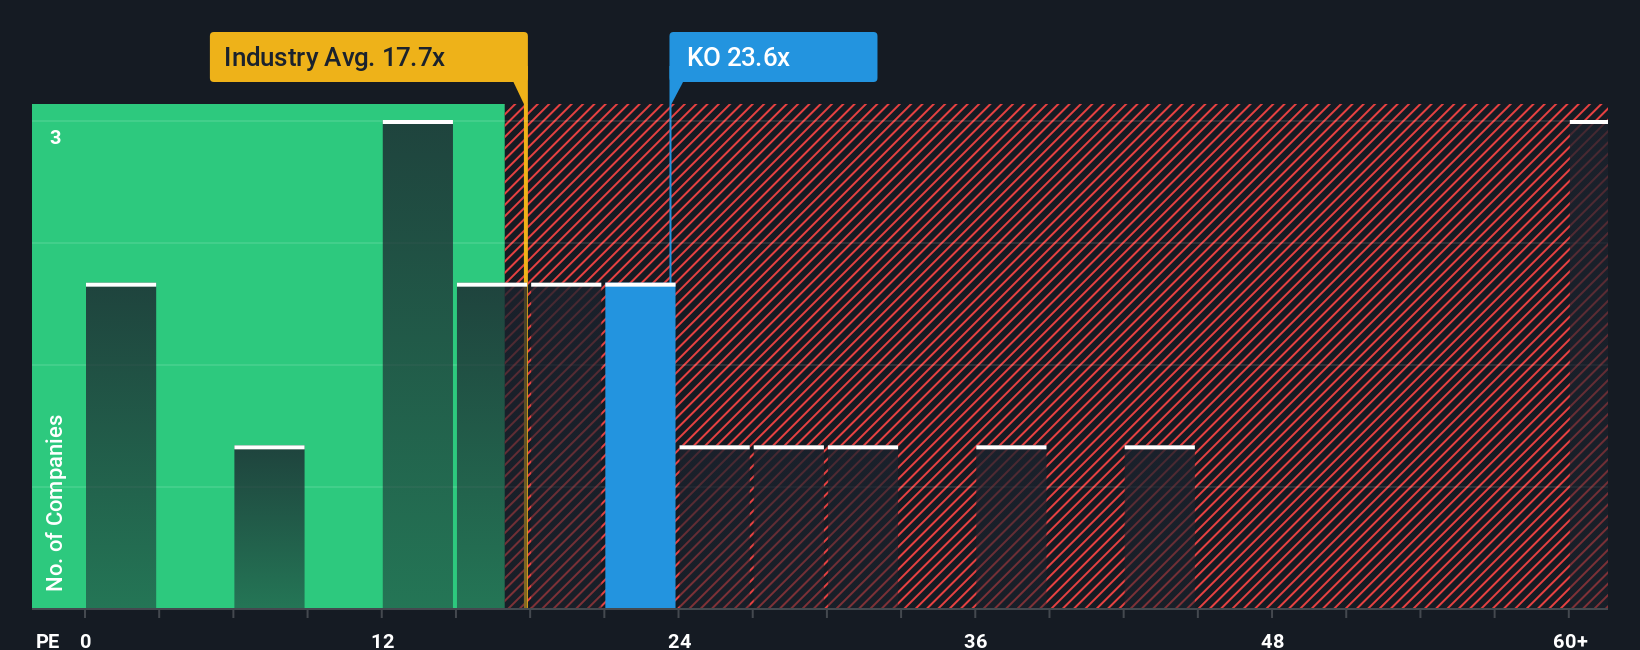
At the moment, Coca-Cola trades at a PE ratio of 23x. This is above the Beverage industry average of 17.36x, but below the average of its closest peers, who typically trade at around 27.57x. On the surface, this might suggest Coca-Cola is a bit more expensive than the sector as a whole but cheaper than some direct competitors. However, these comparisons can overlook the company’s unique growth profile, risk factors, and profitability.
That is why Simply Wall St’s Fair Ratio offers a more tailored benchmark. The Fair Ratio for Coca-Cola is currently 24.28x, which factors in not just industry and market cap, but also Coca-Cola’s profitability, earnings growth, and associated risks. This makes it a more comprehensive guide than simply comparing to generic industry norms or peer groups.
Since Coca-Cola’s current PE ratio of 23x is just slightly below the Fair Ratio of 24.28x, the stock appears to be trading at close to its fair value.
Result: ABOUT RIGHT
PE ratios tell one story, but what if the real opportunity lies elsewhere? Discover companies where insiders are betting big on explosive growth.
Upgrade Your Decision Making: Choose your Coca-Cola Narrative
Earlier, we mentioned that there is an even better way to understand valuation, so let’s introduce you to Narratives. A Narrative is more than just numbers; it’s your personalized story of how you see Coca-Cola’s future, combining your interpretation of what the company does well, the challenges it faces, and what all of this means for its future results and fair value. Narratives link a company’s unique story, your assumptions about its future revenue, margins, and growth, and then directly connect those to a customized financial forecast and fair value estimate.
On Simply Wall St’s Community page, millions of investors use Narratives as an accessible tool to organize their thinking and update their views as new developments such as earnings or industry news come in. Narratives can quickly show you if you believe Coca-Cola is worth buying, selling, or holding by comparing your own Fair Value estimate to the current market Price, and they automatically refresh in response to the latest information.
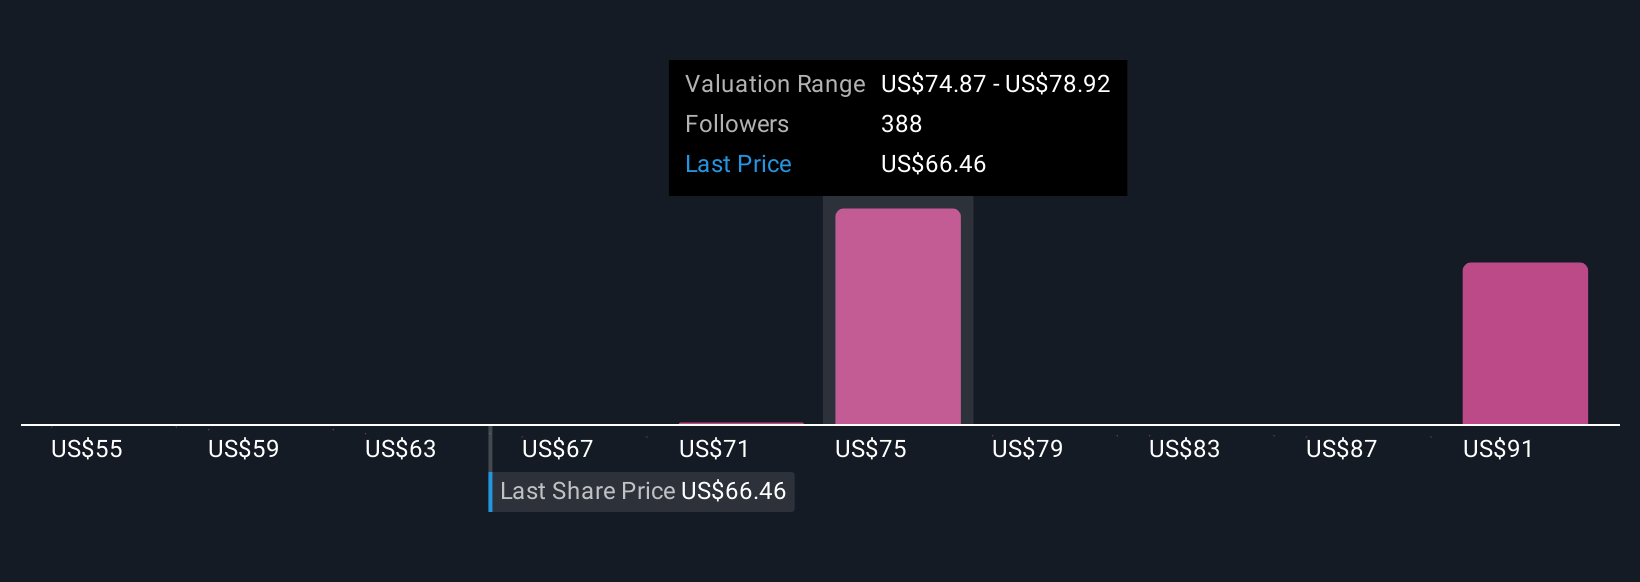
For example, some investors with a bullish Narrative see Coca-Cola’s fair value at $85 per share, banking on growth from new product lines, while more cautious users estimate fair value as low as $67, focusing on risks from regulation or changing consumer tastes. This shows how Narratives reflect diverse, dynamic perspectives.
For Coca-Cola, we'll make it really easy for you with previews of two leading Coca-Cola Narratives:
Fair Value: $71.00
Current Price Discount: 1.8% undervalued
Revenue Growth Rate: 6.64%
- Coca-Cola's status as a global leader, resilient through economic cycles, makes it attractive to investors who value stability and steady dividends.
- The company faces a shifting market environment, with opportunities from digital transformation and emerging markets, but also risks from tariffs and currency volatility.
- Despite strong performance and adaptability, the narrative currently sees the stock as fairly valued due to a combination of rich valuation and future uncertainties.
Fair Value: $67.50
Current Price Premium: 3.3% overvalued
Revenue Growth Rate: 5.23%
- The recent Fed rate cut slightly raises Coca-Cola’s intrinsic value, but the stock remains only modestly undervalued according to the DCF model.
- Long-term, Coca-Cola is expected to deliver steady cash flows and maintain its dividend appeal, though future revenue growth and margins will likely moderate.
- While KO trades at a premium versus industry peers, its strong net margins and reliable cash flow partially justify this, positioning the stock as a defensive, income-oriented holding as bond yields fall.
Do you think there's more to the story for Coca-Cola? Create your own Narrative to let the Community know!
This article by Simply Wall St is general in nature. We provide commentary based on historical data and analyst forecasts only using an unbiased methodology and our articles are not intended to be financial advice. It does not constitute a recommendation to buy or sell any stock, and does not take account of your objectives, or your financial situation. We aim to bring you long-term focused analysis driven by fundamental data. Note that our analysis may not factor in the latest price-sensitive company announcements or qualitative material. Simply Wall St has no position in any stocks mentioned.
Have feedback on this article? Concerned about the content? Get in touch with us directly. Alternatively, email editorial-team@simplywallst.com