
- PREMIUM
- LIVE QUOTES
- INSTITUTIONS
 Index Options
 State Street
 CME Group
 Nasdaq
 Cboe
Cboe TradingView
 Wall Street Journal
ImmunityBio (IBRX): Assessing Valuation After FDA Approval for Breakthrough Bladder Cancer Therapy
ImmunityBio (IBRX) has seized the spotlight after its recent presentation at the ESMO Congress 2025 in Berlin. Investors are paying close attention, as the company highlights progress on its innovative therapies for challenging forms of bladder cancer.
See our latest analysis for ImmunityBio.
ImmunityBio's recent FDA approval and prominent showing at the ESMO Congress have fueled fresh optimism, yet the momentum has not fully translated into share price performance. Although the stock notched a 3.35% gain over the past day, its 1-year total shareholder return remains deeply negative at -53.6%. This represents a story of promising breakthroughs coming alongside a still-recovering share price.
Curious to see what other biotech and pharma names are showing potential? Explore the latest opportunities with our dedicated healthcare stock screener: See the full list for free.
With analyst price targets signaling substantial upside and recent breakthroughs adding momentum, the question for investors now is clear: is ImmunityBio trading at a deep discount with room to run, or has the market already factored in its future growth?
Price-to-Sales Ratio of 43x: Is It Justified?
ImmunityBio currently trades at a price-to-sales ratio of 43x, far higher than both its industry and peer group averages. At the last close of $2.47, the stock's valuation looks extremely rich when benchmarked against these comparatives.
The price-to-sales (P/S) ratio measures how much investors are willing to pay for each dollar of a company's revenue. In biotech, high P/S multiples can sometimes reflect future growth expectations. However, such a substantial premium is notable.
At 43x sales, the market is pricing in explosive revenue increases and perhaps significant product breakthroughs. By contrast, the peer group trades at just 7.7x sales, while the US biotech industry sits at an average of 10.8x. Even compared to the estimated fair price-to-sales ratio of 33.5x, ImmunityBio stands out as aggressively valued. This suggests sentiment might be ahead of fundamentals or future gains are simply expected to be dramatic.
Explore the SWS fair ratio for ImmunityBio
Result: Price-to-Sales of 43 (OVERVALUED)
However, ongoing net losses and a steep valuation leave ImmunityBio exposed if revenue growth or regulatory progress does not meet high expectations.
Find out about the key risks to this ImmunityBio narrative.
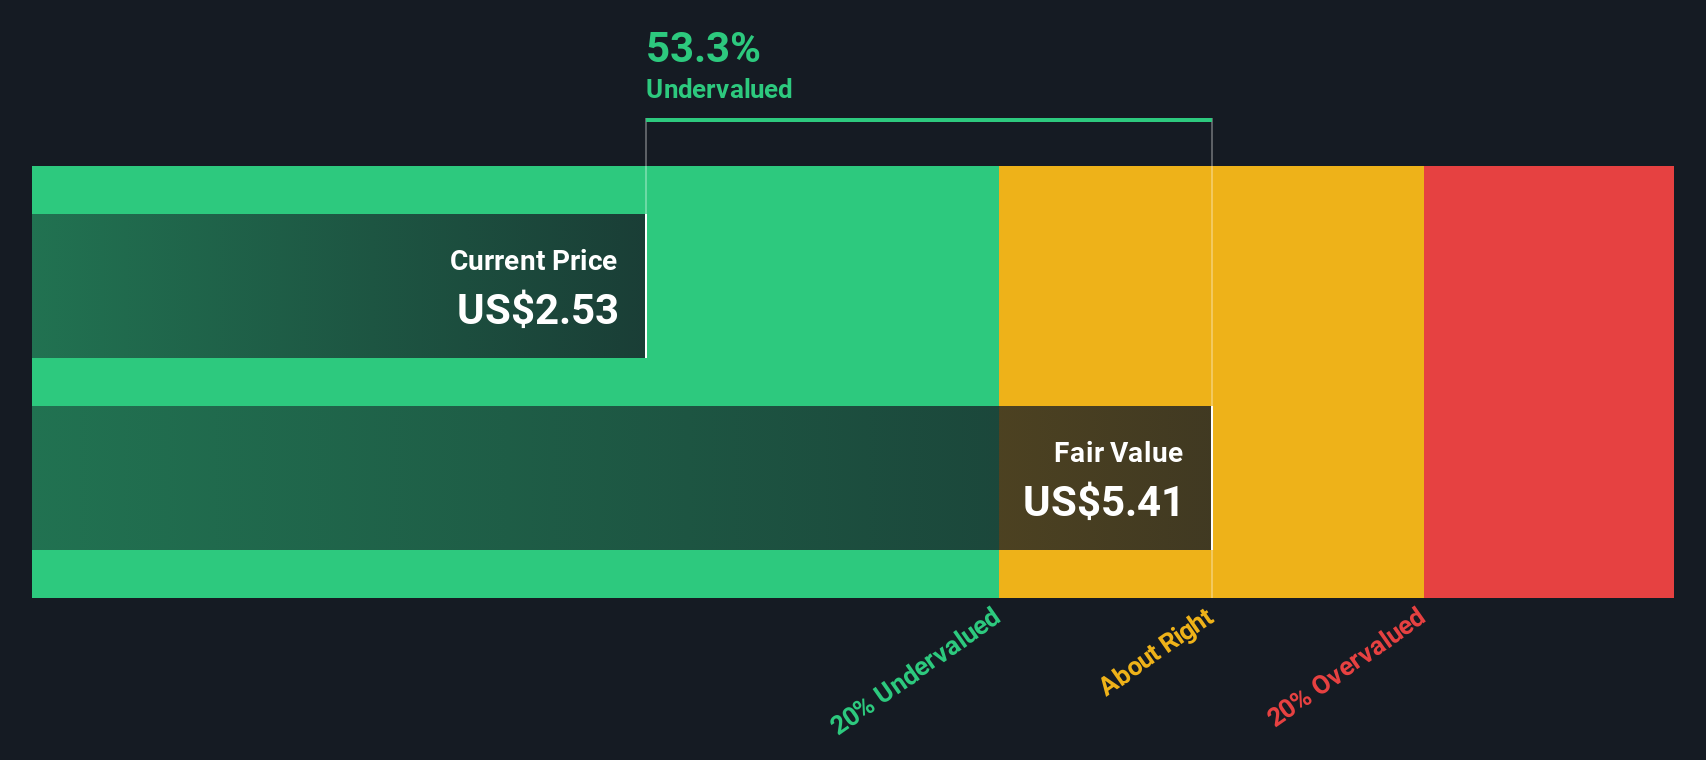
Another View: Discounted Cash Flow Suggests Undervaluation
While ImmunityBio's price-to-sales ratio signals a hefty premium, our DCF model offers a stark contrast, indicating the stock is trading at a 51.4% discount to its estimated fair value. This method values future cash flows rather than current revenues, raising an important question: Is the market missing the long-term upside?
Look into how the SWS DCF model arrives at its fair value.
Simply Wall St performs a discounted cash flow (DCF) on every stock in the world every day (check out ImmunityBio for example). We show the entire calculation in full. You can track the result in your watchlist or portfolio and be alerted when this changes, or use our stock screener to discover undervalued stocks based on their cash flows. If you save a screener we even alert you when new companies match - so you never miss a potential opportunity.
Build Your Own ImmunityBio Narrative
If you have a different perspective or want to test your own assumptions, you can shape your own ImmunityBio narrative in just a few minutes. Do it your way
A great starting point for your ImmunityBio research is our analysis highlighting 2 key rewards and 2 important warning signs that could impact your investment decision.
Ready to Uncover More Winning Investment Angles?
Don’t wait for opportunities to pass by. Let our stock screeners point you to breakthrough potential in areas that could shape your portfolio’s future success.
- Capitalize on the surge in artificial intelligence by targeting growth stories using these 27 AI penny stocks. Spot innovators driving digital transformation.
- Strengthen your income strategy by accessing generous yield opportunities through these 17 dividend stocks with yields > 3%. Identify options that consistently deliver above-average payouts.
- Position yourself early in the blockchain evolution by searching for standouts in these 80 cryptocurrency and blockchain stocks. Follow the momentum where technology meets finance.
This article by Simply Wall St is general in nature. We provide commentary based on historical data and analyst forecasts only using an unbiased methodology and our articles are not intended to be financial advice. It does not constitute a recommendation to buy or sell any stock, and does not take account of your objectives, or your financial situation. We aim to bring you long-term focused analysis driven by fundamental data. Note that our analysis may not factor in the latest price-sensitive company announcements or qualitative material. Simply Wall St has no position in any stocks mentioned.
Have feedback on this article? Concerned about the content? Get in touch with us directly. Alternatively, email editorial-team@simplywallst.com