
Has Invesco’s 28.5% Year-to-Date Surge Left it Trading Above Fair Value?
If you're wondering whether now is the right time to buy, hold, or sell Invesco, you're not alone. Over the past five years, the stock has delivered an impressive 108.8% return, which is hard to ignore no matter how long you've been investing. Even more recently, Invesco is up 28.5% year-to-date and 34.8% over the last twelve months, signaling a notable shift in market sentiment. While the last week saw a slight dip of 0.5%, and the last month showed a modest gain of 1.1%, these movements are fairly typical for a stock that has been in the spotlight.
Investors are reacting to a mix of sector trends and company-specific developments. Invesco has been making strategic adjustments in response to the evolving regulatory environment affecting asset managers. Initiatives around sustainable investing and digital distribution have caught the attention of institutional clients, helping to shape the long-term narrative and, indirectly, the recent price moves. While the market’s perception of risk seems to be normalizing, the pace of innovation is also making some investors take a second look at valuation.
Speaking of valuation, Invesco currently scores just 1 out of 6 on our proprietary value checklist. This suggests it is only undervalued by one measure, and not across the board. In the next sections, we will break down what goes into this valuation score, explore the popular methods analysts use, and just as importantly, reveal a smarter way to make sense of Invesco’s true worth that you might not see anywhere else.
Invesco scores just 1/6 on our valuation checks. See what other red flags we found in the full valuation breakdown.
Approach 1: Invesco Excess Returns Analysis
The Excess Returns valuation model examines whether a company generates returns on its invested capital that exceed its cost of equity, ultimately estimating whether investors are being suitably compensated for risk. For Invesco, the key stats tell a clear story: the firm’s Book Value stands at $24.36 per share, with a stable Earnings Per Share (EPS) of $1.20, as determined by the median return on equity from the past 5 years. The Cost of Equity per share is higher, at $2.04, resulting in a negative Excess Return of $-0.83 per share. Invesco earns an average return on equity of just 5.02%. Its stable Book Value, also based on five-year medians, is $23.95 per share.
This approach suggests that Invesco’s returns are not outperforming its cost of capital. This raises red flags from a value investing perspective. The calculated intrinsic value based on the Excess Returns Model is substantially below the current share price, indicating that Invesco is trading at a 164.2% premium relative to this method’s estimate. In other words, at today’s levels, Invesco appears heavily overvalued according to this approach.
Result: OVERVALUED
Our Excess Returns analysis suggests Invesco may be overvalued by 164.2%. Find undervalued stocks or create your own screener to find better value opportunities.
Approach 2: Invesco Price vs Earnings
For profitable companies like Invesco, the Price-to-Earnings (PE) ratio is a popular and meaningful valuation tool because it directly relates a company’s share price to its annual earnings per share. Since profits are the ultimate driver of shareholder returns over time, the PE ratio provides a quick snapshot of how much investors are willing to pay for each dollar of earnings generated by the business.
It is important to recognize that the “right” or fair PE ratio for a company varies depending on earnings growth potential and perceived risk. Fast-growing companies with predictable profits typically command higher PE ratios, while firms with uncertain outlooks or operational challenges may trade on lower multiples.
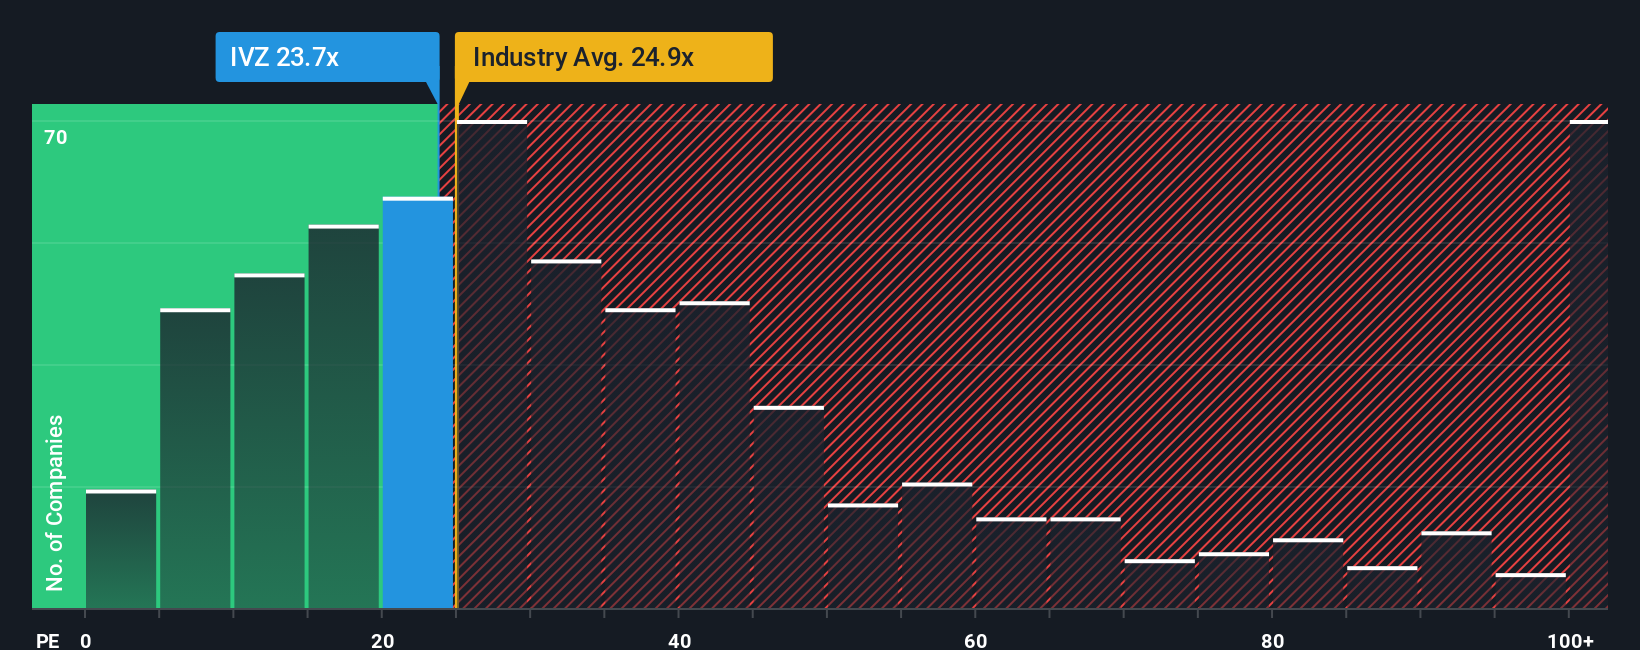
Currently, Invesco trades on a PE ratio of 23.9x, which is higher than the peer group average of 22.2x but below the Capital Markets industry average of 26.1x. Simply Wall St’s proprietary Fair Ratio for Invesco is 22.3x. This Fair Ratio takes more than just peer or sector comparisons into account and factors in elements like expected growth, profit margins, company size, and risk profile to produce a benchmark tailored to Invesco specifically. By using these variables, the Fair Ratio aims for a more precise and holistic assessment of value than industry or peer averages alone.
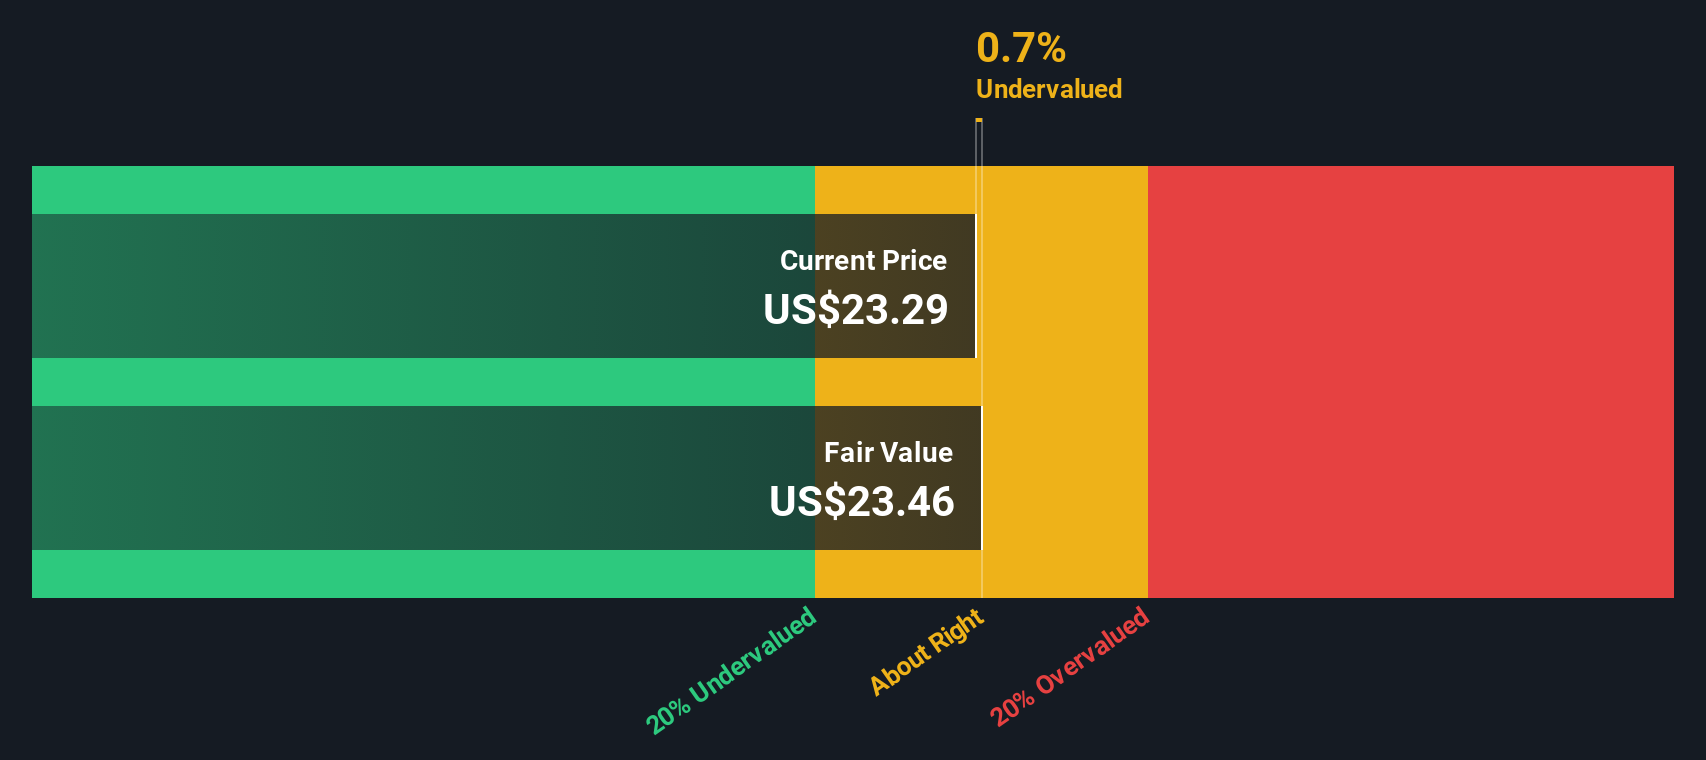
With Invesco’s PE ratio just slightly above its Fair Ratio, the difference is marginal and not enough to conclude the stock is mispriced. Based on the preferred multiple, Invesco’s valuation looks to be about right at current levels.
Result: ABOUT RIGHT
PE ratios tell one story, but what if the real opportunity lies elsewhere? Discover companies where insiders are betting big on explosive growth.
Upgrade Your Decision Making: Choose your Invesco Narrative
Earlier we mentioned there is an even better way to understand valuation. Let’s introduce you to Narratives, a simple yet powerful feature that enables you to connect your perspective on Invesco’s business with the numbers behind its future value. A Narrative is more than just data; it is your interpretation of the company’s story, how catalyst events or risks might shape Invesco’s growth, what you expect for revenue, earnings, or margins, and ultimately, your idea of fair value. Narratives bridge the gap from company story to forecast, and then from forecast to valuation, making it easier to decide whether to buy or sell by seeing how your Fair Value stacks up against today’s share price.
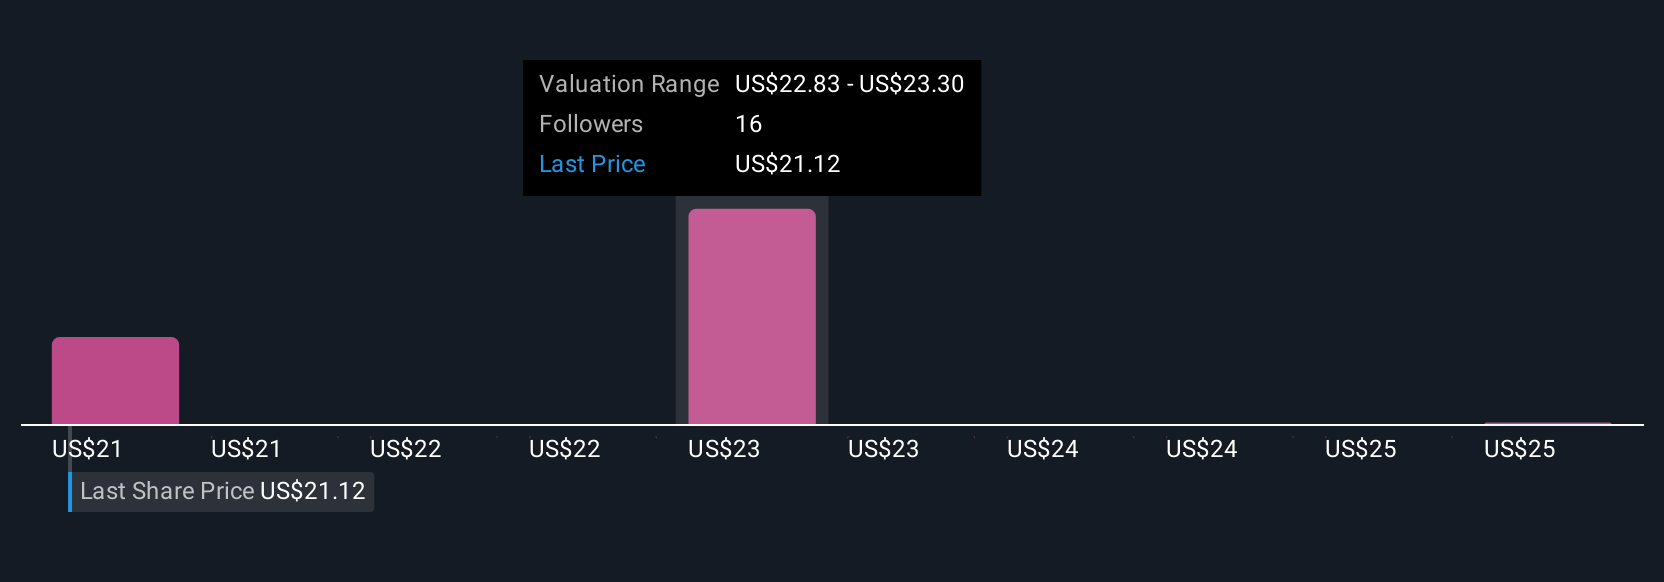
Available right on Simply Wall St’s Community page and trusted by millions, Narratives update instantly when news or earnings hit, so your investment thesis stays current. For example, some investors see digital transformation and ETF modernization as the key to unlocking future growth and assign Invesco a high target price, while others focus on fee compression and regulatory headwinds, reaching a much lower value. Narratives empower you to make decisions dynamically, using both your reasoning and the latest information.
Do you think there's more to the story for Invesco? Create your own Narrative to let the Community know!
This article by Simply Wall St is general in nature. We provide commentary based on historical data and analyst forecasts only using an unbiased methodology and our articles are not intended to be financial advice. It does not constitute a recommendation to buy or sell any stock, and does not take account of your objectives, or your financial situation. We aim to bring you long-term focused analysis driven by fundamental data. Note that our analysis may not factor in the latest price-sensitive company announcements or qualitative material. Simply Wall St has no position in any stocks mentioned.
Have feedback on this article? Concerned about the content? Get in touch with us directly. Alternatively, email editorial-team@simplywallst.com