
Assessing Terex After 5% Weekly Gain and Strong 2025 Market Momentum
Thinking about Terex stock and not quite sure whether to buy, hold, or sell? You’re definitely not alone. After all, this equipment manufacturer has given investors a real rollercoaster in recent years, mixing strong multi-year returns with the occasional dip. Over the last five days, Terex bounced up 5.0%, and it’s gone nearly sideways in the past month with just a 0.8% uptick. Year to date, though, the stock is up an impressive 19.1%, hinting at a resurgence in investor confidence or perhaps a shift in the broader machinery sector. If you zoom out even more, the stock has more than doubled over five years, even though it dipped 4.2% over the past twelve months, showing just how fast sentiment can change for a company like this.
Many investors will be weighing those numbers against the company’s valuation metrics. Our own value score for Terex lands at 4 out of 6, meaning the company screens as undervalued in four different ways. This is a strong sign, but maybe not a slam dunk just yet. The recent climb in share price backs up that cautious optimism, especially given broader market changes that are affecting industrials across the board.
So how should you actually be thinking about Terex’s true value in today’s market? Let’s break down what goes into that value score, looking at all the major valuation methods analysts use, and then wrap up with a different perspective on what many investors are still missing when it comes to understanding what Terex is really worth.
Why Terex is lagging behind its peers
Approach 1: Terex Discounted Cash Flow (DCF) Analysis
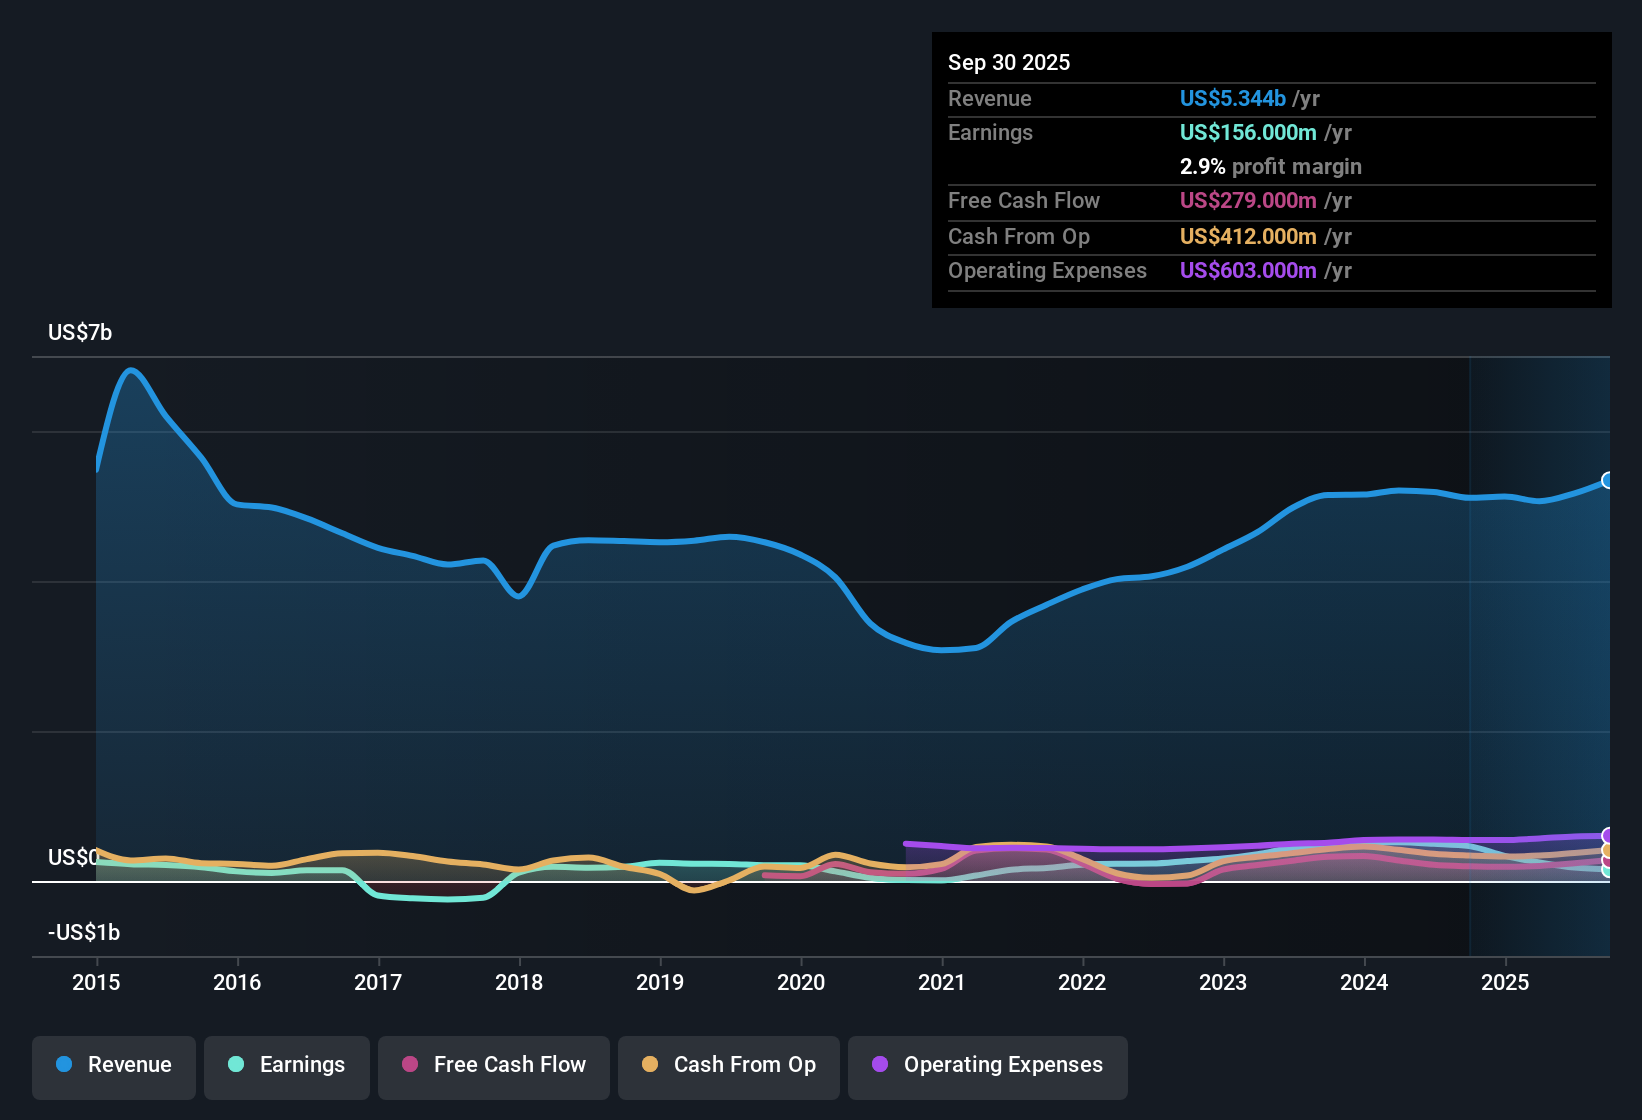
The Discounted Cash Flow (DCF) model projects a company’s future cash flows and discounts them back to their present value, giving investors an estimate of what the company is really worth today. For Terex, analysts look at its Free Cash Flow (FCF) performance, which was $243.7 million over the last twelve months. Analysts forecast Terex’s FCF to grow steadily, reaching $436 million in 2027 and slightly above $520 million by 2035. The projections after 2027 are extrapolated by Simply Wall St.
These cash flows are discounted using typical rates to account for the time value of money and risk involved in future estimates. After calculating these numbers, the DCF model provides an estimated fair value per share of $89.41. Based on the current market price, this figure suggests Terex stock is trading at a 40.7% discount to its intrinsic value, indicating that it is significantly undervalued according to this analysis.
Result: UNDERVALUED
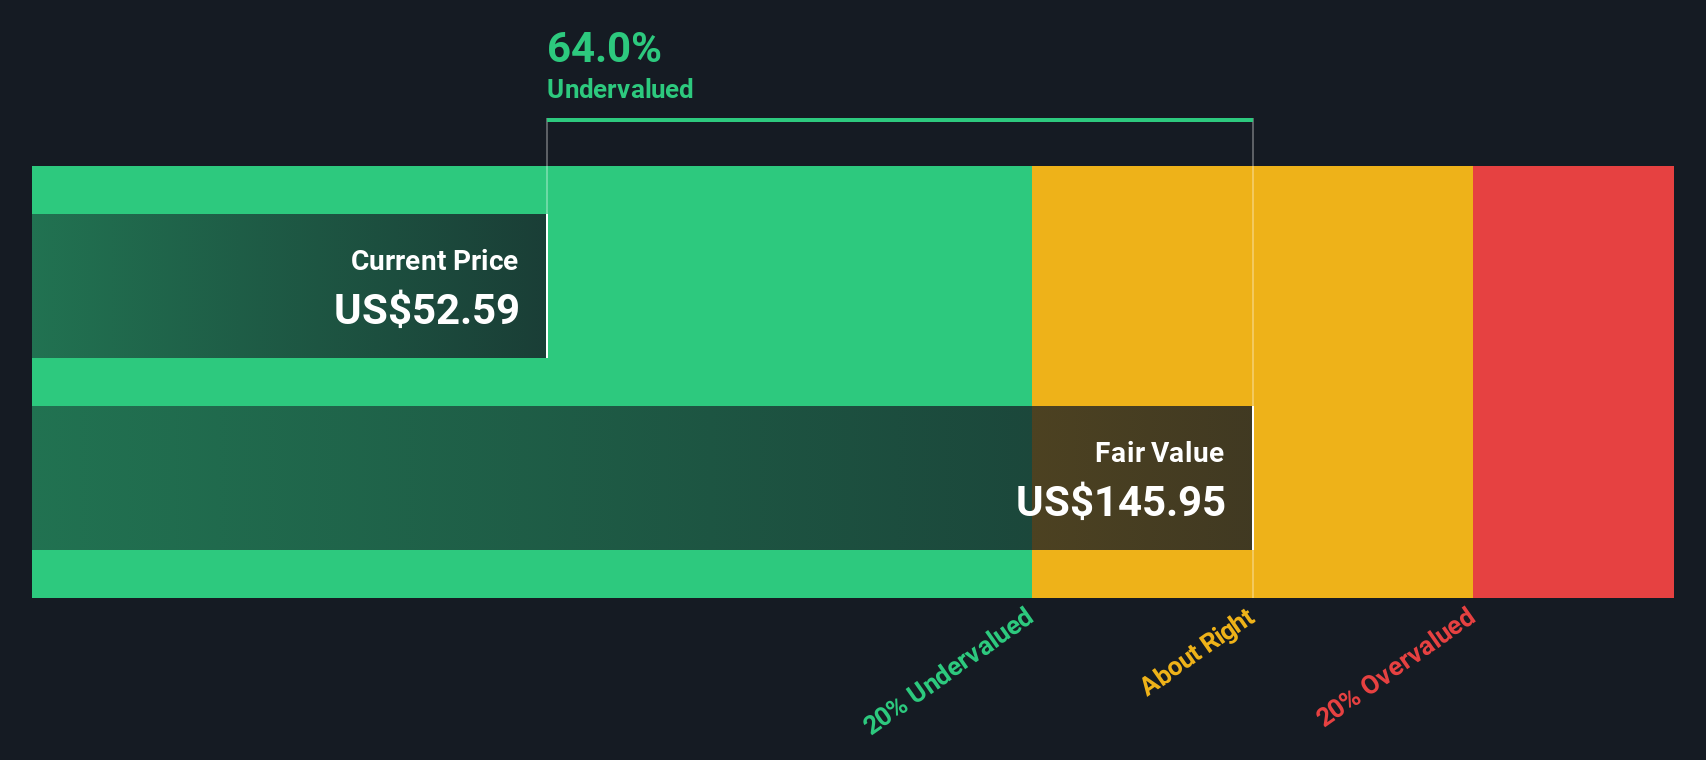
Our Discounted Cash Flow (DCF) analysis suggests Terex is undervalued by 40.7%. Track this in your watchlist or portfolio, or discover more undervalued stocks.
Approach 2: Terex Price vs Earnings
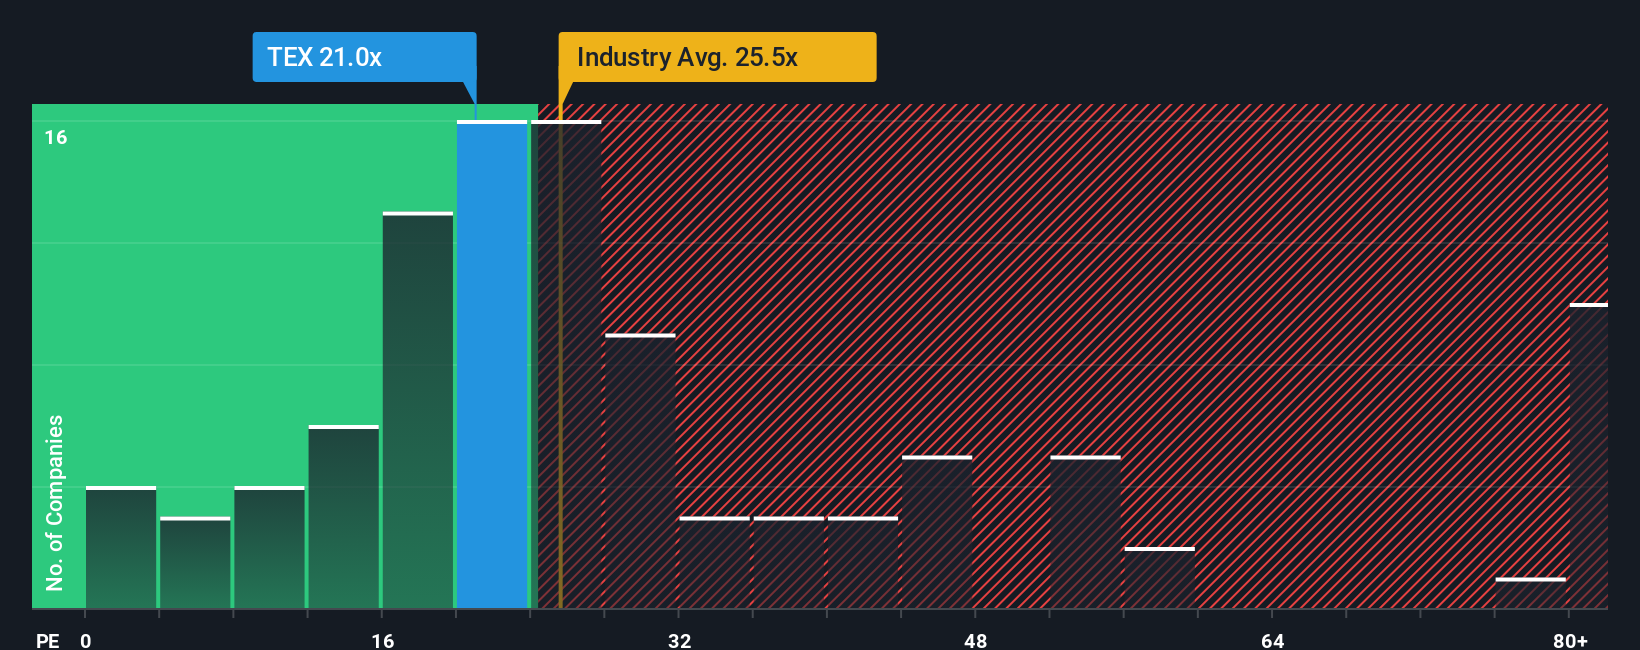
For profitable companies like Terex, the price-to-earnings (PE) ratio is one of the most common and informative metrics investors use to gauge value. The PE ratio lets you see how much investors are willing to pay for each dollar of the company’s earnings. Companies with stronger growth prospects or lower risk typically command higher PE ratios, while those with unpredictable earnings or added risk might trade at lower multiples.
Right now, Terex trades at a PE ratio of 19.2x. That compares to the average Machinery industry PE of 24.2x and a peer group average of 18.7x. On the surface, Terex appears a bit cheaper than its overall industry, but roughly in line with its peers.
To get a sharper sense of what is reasonable for Terex specifically, it is helpful to bring in the Fair Ratio, which is a proprietary metric from Simply Wall St. The Fair Ratio is not just a straight average; it incorporates Terex’s unique blend of earnings growth, profit margin, market cap, industry dynamics, and company-specific risks. This gives a benchmark that is uniquely tailored, making it more useful than the generic comparisons.
Simply Wall St’s Fair Ratio for Terex is 39.0x, which is much higher than both its actual PE and the industry average. With the current PE at 19.2x, Terex is trading well below what would be expected given its fundamentals, suggesting the stock could be significantly undervalued by this measure.
Result: UNDERVALUED
PE ratios tell one story, but what if the real opportunity lies elsewhere? Discover companies where insiders are betting big on explosive growth.
Upgrade Your Decision Making: Choose your Terex Narrative
Earlier we mentioned that there's an even better way to understand valuation, so let's introduce you to Narratives. A Narrative is a simple, story-driven explanation behind your numbers, connecting your outlook for a company's business (like future revenue, profit margins, and the world it operates in) with your estimate of fair value.
This approach lets you link Terex's big-picture trends, management strategies, and risks to a financial forecast and then to a fair value per share. This makes your investment decisions far more meaningful than numbers alone. Narratives are easy to use and available to everyone on Simply Wall St’s Community page, where millions of investors discuss, share, and update their views in real time.
With Narratives, you can see how your fair value compares to the current stock price. This helps you decide whether to buy, hold, or sell as new news, earnings, or risks emerge.
For example, some Terex Narratives are bullish, projecting strong global equipment demand and targeting a price as high as $73.0. Other Narratives are cautious, predicting margin pressure or economic headwinds and setting a fair value as low as $38.0. Whichever story you believe fits the company’s future, Narratives help you make decisions from your own perspective and adjust dynamically as new facts arrive.
Do you think there's more to the story for Terex? Create your own Narrative to let the Community know!
This article by Simply Wall St is general in nature. We provide commentary based on historical data and analyst forecasts only using an unbiased methodology and our articles are not intended to be financial advice. It does not constitute a recommendation to buy or sell any stock, and does not take account of your objectives, or your financial situation. We aim to bring you long-term focused analysis driven by fundamental data. Note that our analysis may not factor in the latest price-sensitive company announcements or qualitative material. Simply Wall St has no position in any stocks mentioned.
Have feedback on this article? Concerned about the content? Get in touch with us directly. Alternatively, email editorial-team@simplywallst.com