
Kraken Robotics (TSXV:PNG): A Fresh Look at Valuation After Record Defense Adoption at 2025 REPMUS Naval Exercise
Kraken Robotics (TSXV:PNG) is drawing attention after its synthetic aperture sonar systems were used by a record number of participants at the 2025 REPMUS international naval exercise in Portugal. Seven naval teams and several underwater vehicle manufacturers deployed Kraken’s technology, highlighting a growing trend of adoption within global maritime security.
See our latest analysis for Kraken Robotics.
Kraken Robotics has been capturing the market’s attention, especially with its technology now in the hands of more global naval teams than ever before. The momentum around these recent defense wins is echoed in the stock’s performance: Kraken’s share price has surged 127.6% year-to-date, and its one-year total shareholder return is an eye-catching 253.6%. That strength signals investors are increasingly optimistic about the company’s growth prospects amid rising adoption of its sonar systems.
If defense tech breakthroughs like Kraken’s have you looking for the next set of opportunities, consider exploring the aerospace and defense sector. See the full list for free.
With such impressive gains in both technology adoption and share price, the key question now is whether Kraken Robotics remains an undervalued opportunity or if the market has already priced in future growth potential for investors.
Price-to-Earnings of 122.8x: Is it justified?
Kraken Robotics is trading at a lofty price-to-earnings (P/E) ratio of 122.8, well above both its industry peers and the broader market. This signals high investor expectations relative to its recent earnings. The last close price of CA$5.94 strongly exceeds typical comparative benchmarks.
The P/E multiple measures how much investors are willing to pay for every dollar of net earnings the company generates. For a technology innovator like Kraken Robotics, a high P/E can sometimes reflect exceptional growth prospects or unique industry positioning. However, such elevated multiples may also imply that the market is pricing in aggressive future earnings expansion.
At 122.8x, Kraken’s P/E is far higher than the North American Electronic industry average of 25.7x and significantly above its peer group’s average of 27.8x. Compared to the estimated fair P/E ratio of 58.6x, Kraken’s shares appear richly valued. This suggests that the market may be pricing in a best-case scenario for future profit growth.
Explore the SWS fair ratio for Kraken Robotics
Result: Price-to-Earnings of 122.8x (OVERVALUED)
However, if revenue growth slows or profit margins compress, Kraken’s high valuation could face pressure due to a shift in market sentiment.
Find out about the key risks to this Kraken Robotics narrative.
Another View: DCF Insights
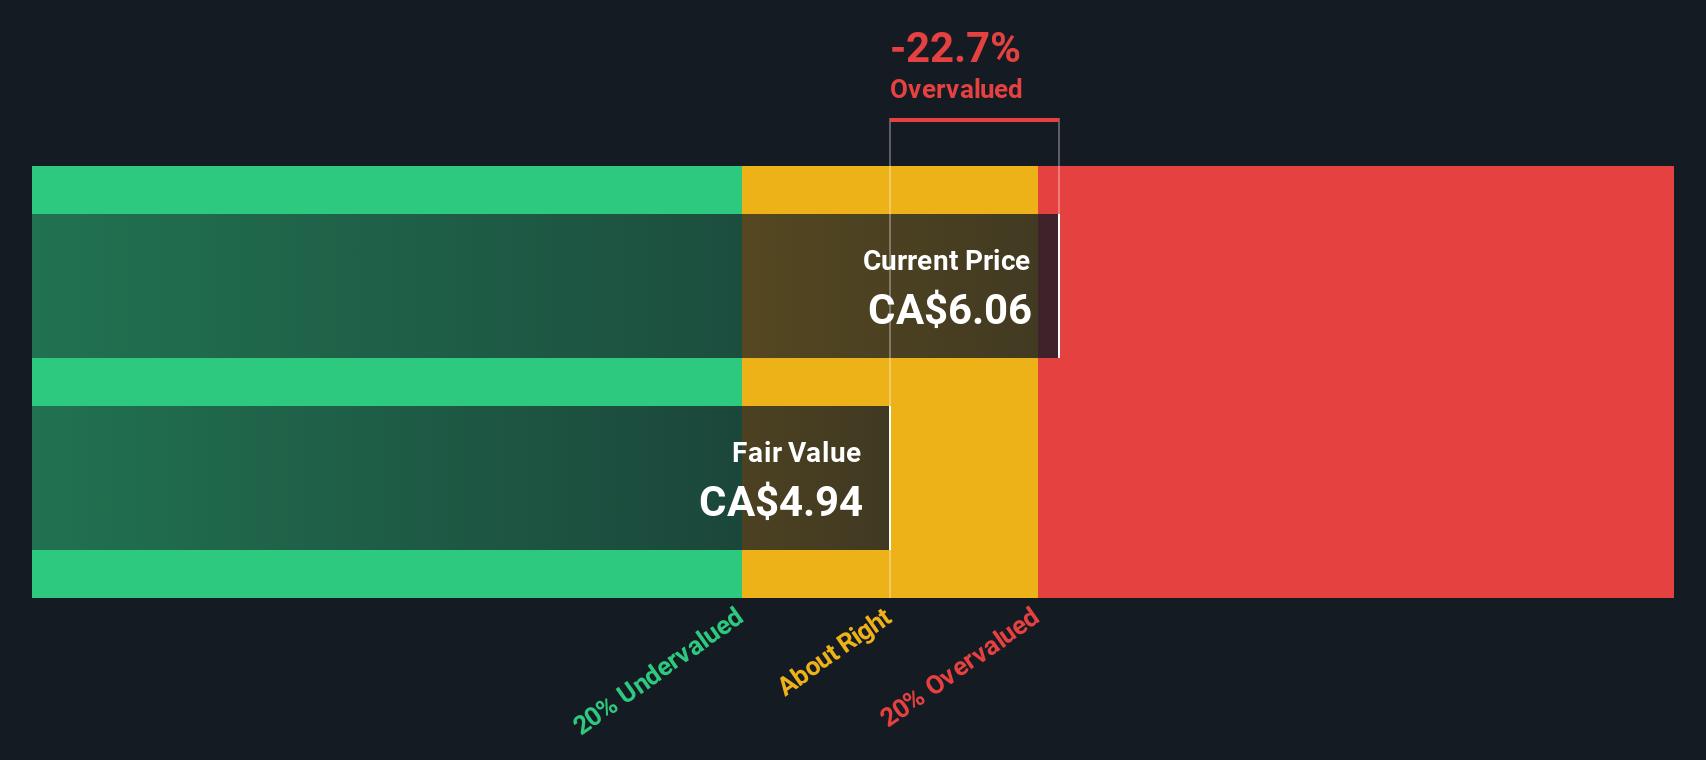
While Kraken Robotics’ high market valuation stands out, the SWS DCF model offers a different perspective. This method estimates the fair value at CA$4.93 per share, which is notably below the current price of CA$5.94. By this measure, the stock may be overvalued. Does the market know something the model does not? Alternatively, are investors getting ahead of themselves?
Look into how the SWS DCF model arrives at its fair value.
Simply Wall St performs a discounted cash flow (DCF) on every stock in the world every day (check out Kraken Robotics for example). We show the entire calculation in full. You can track the result in your watchlist or portfolio and be alerted when this changes, or use our stock screener to discover undervalued stocks based on their cash flows. If you save a screener we even alert you when new companies match - so you never miss a potential opportunity.
Build Your Own Kraken Robotics Narrative
If you see the story differently, or simply want to dig into the numbers and craft your own outlook, it only takes a few minutes to build your personal analysis and insights, your way. Do it your way
A great starting point for your Kraken Robotics research is our analysis highlighting 2 key rewards and 2 important warning signs that could impact your investment decision.
Looking for More Investment Ideas?
Set yourself apart from the crowd by acting on high-impact insights others might overlook. Up your portfolio game by checking out these unique stock opportunities now:
- Accelerate your search for fast-growing innovation by targeting these 24 AI penny stocks, which are shaking up industries with real-world artificial intelligence breakthroughs.
- Capture steady returns and consistent income by screening for these 20 dividend stocks with yields > 3%, which offer attractive yields above 3%.
- Position yourself early in technology’s next frontier by spotting potential winners among these 26 quantum computing stocks, companies working on tomorrow’s quantum computing solutions.
This article by Simply Wall St is general in nature. We provide commentary based on historical data and analyst forecasts only using an unbiased methodology and our articles are not intended to be financial advice. It does not constitute a recommendation to buy or sell any stock, and does not take account of your objectives, or your financial situation. We aim to bring you long-term focused analysis driven by fundamental data. Note that our analysis may not factor in the latest price-sensitive company announcements or qualitative material. Simply Wall St has no position in any stocks mentioned.
Have feedback on this article? Concerned about the content? Get in touch with us directly. Alternatively, email editorial-team@simplywallst.com