
What Should Investors Make of Amphenol’s Soaring Shares in 2025?
Thinking about what to do with Amphenol stock? You’re certainly not alone. With shares closing recently at $125.60 and posting a strong 82.0% return year-to-date, Amphenol has clearly caught the market’s attention. Even over the past five years, the stock has soared 357.9%. Those are the kind of numbers that make headlines and have long-term investors smiling. Shorter-term moves have been more mixed, with a 5.3% gain in the past month offset by a slight 0.2% dip in just the last week. These little bumps and sprints often reflect changing perceptions about risk and growth, sometimes in connection with broader market shifts that influence the tech and manufacturing sectors alike.
But impressive gains do not necessarily tell the whole story when it comes to value. If you’re hoping this is just the beginning of even more upside, it helps to dig into the fundamentals. By looking at standard valuation checks, such as price-to-earnings ratios, forward multiples, or cash flow yields, we get a clearer sense of whether Amphenol is actually undervalued right now. Here is an interesting datapoint: the company comes in with a value score of 1, meaning it only ticks one out of six classic undervaluation boxes at the moment.
Still, valuation is rarely as simple as a single number or a checklist. Up next, we will break down what these different valuation approaches really reveal and share a smarter, more nuanced way to view whether Amphenol is worth your buy, hold, or sell decision.
Amphenol scores just 1/6 on our valuation checks. See what other red flags we found in the full valuation breakdown.
Approach 1: Amphenol Discounted Cash Flow (DCF) Analysis
The Discounted Cash Flow (DCF) model estimates a company’s intrinsic value by projecting its future cash flows and then discounting those estimates back to today’s dollars. This approach helps investors assess what a business is truly worth, based purely on its potential to generate cash over time, rather than current market sentiment.
For Amphenol, the company’s most recent Free Cash Flow is $3.0 Billion. Looking ahead, analyst forecasts provide projections for up to five years. After that period, further cash flow estimates are extrapolated. According to these forecasts and subsequent estimates, Amphenol’s Free Cash Flow is expected to rise to about $5.6 Billion by the end of 2028, with continued growth in the years beyond.
Using these projections and discounting them to reflect their value in today’s terms, the DCF model calculates an estimated intrinsic value per share of $93.12. With the current share price at $125.60, this means the stock appears 34.9% overvalued based on the DCF approach.
Result: OVERVALUED
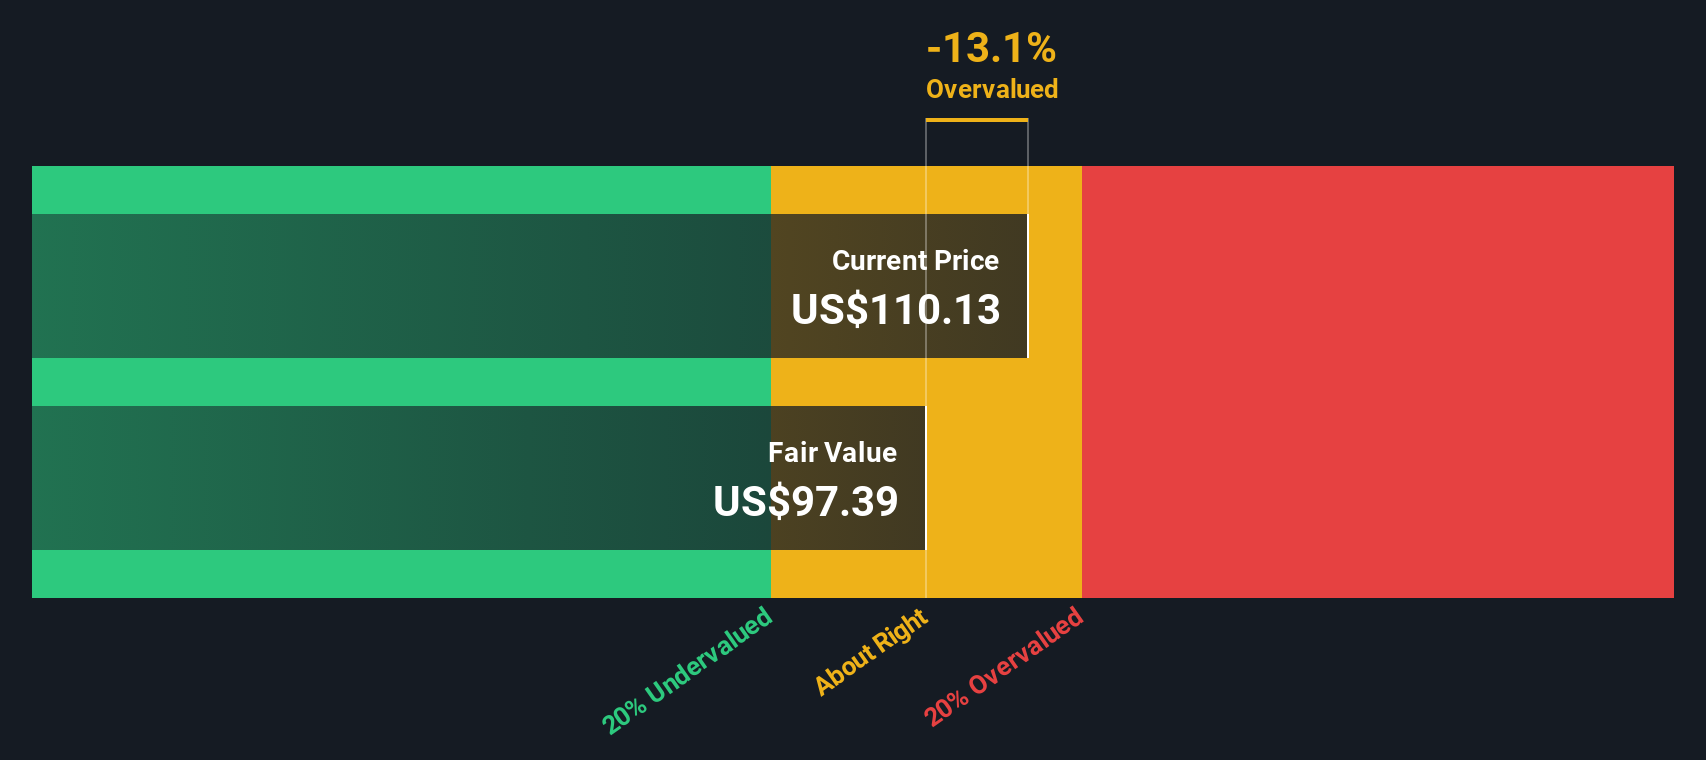
Our Discounted Cash Flow (DCF) analysis suggests Amphenol may be overvalued by 34.9%. Find undervalued stocks or create your own screener to find better value opportunities.
Approach 2: Amphenol Price vs Earnings (PE Ratio)
The Price-to-Earnings (PE) ratio is one of the most widely used valuation tools for profitable companies like Amphenol because it ties a company’s share price directly to its earnings power. PE ratios help investors gauge whether they are paying a reasonable price for each dollar of a company’s earnings, which is particularly meaningful for established and consistently profitable businesses.
It is important to remember that what counts as a “fair” PE ratio can shift based on growth expectations and perceived risks. Companies with stable, high-growth prospects or lower risk profiles typically command higher PE ratios compared to slower-growth or riskier peers.
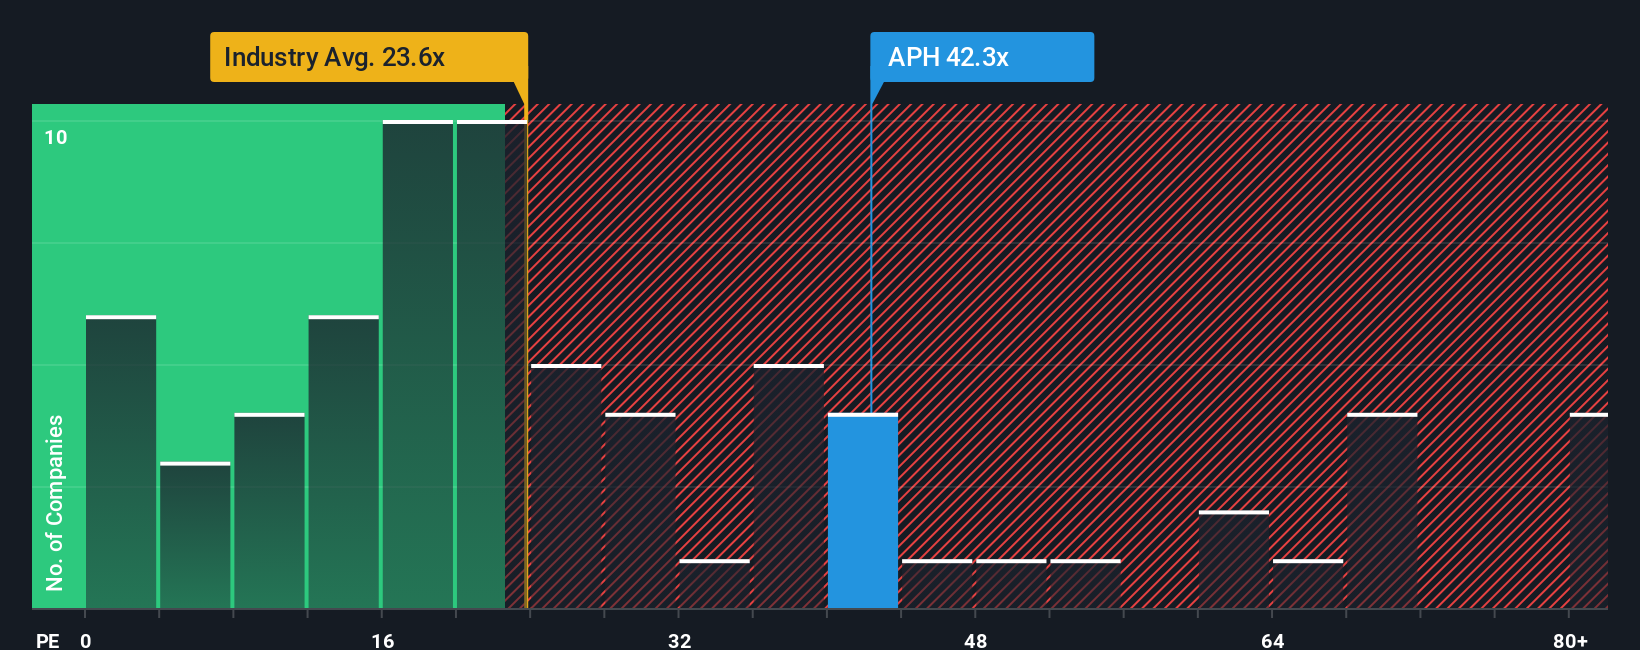
Currently, Amphenol trades on a PE ratio of 48.2x, which places it below the average of its immediate peers at 54.3x but well above the broader Electronic industry average of 26.1x. To get a more nuanced view, we look at Simply Wall St’s proprietary “Fair Ratio,” which is 35.5x for Amphenol. Unlike a simple industry or peer comparison, the Fair Ratio is tailored and considers not just sector averages but Amphenol’s unique profile, including factors like earnings growth, profit margins, industry characteristics, market cap, and specific risks.
With Amphenol’s current PE sitting noticeably above this Fair Ratio benchmark (48.2x compared to 35.5x), the stock looks overvalued by this measure, even accounting for its strong growth profile and sector leadership.
Result: OVERVALUED
PE ratios tell one story, but what if the real opportunity lies elsewhere? Discover companies where insiders are betting big on explosive growth.
Upgrade Your Decision Making: Choose your Amphenol Narrative
Earlier we mentioned that there is an even better way to understand valuation, so let's introduce you to Narratives. In simple terms, a Narrative is your story about a company, linking your perspective on Amphenol’s future, such as how much you believe it can grow or what challenges it faces, directly with financial forecasts and a fair value estimate. Narratives bridge past numbers with future potential by combining your expectations for revenue, earnings, and margins into one clear valuation framework. Narratives are accessible and easy to use on Simply Wall St’s Community page, where millions of investors refine and share their outlooks. This makes it a powerful tool when weighing buy, hold, or sell decisions.
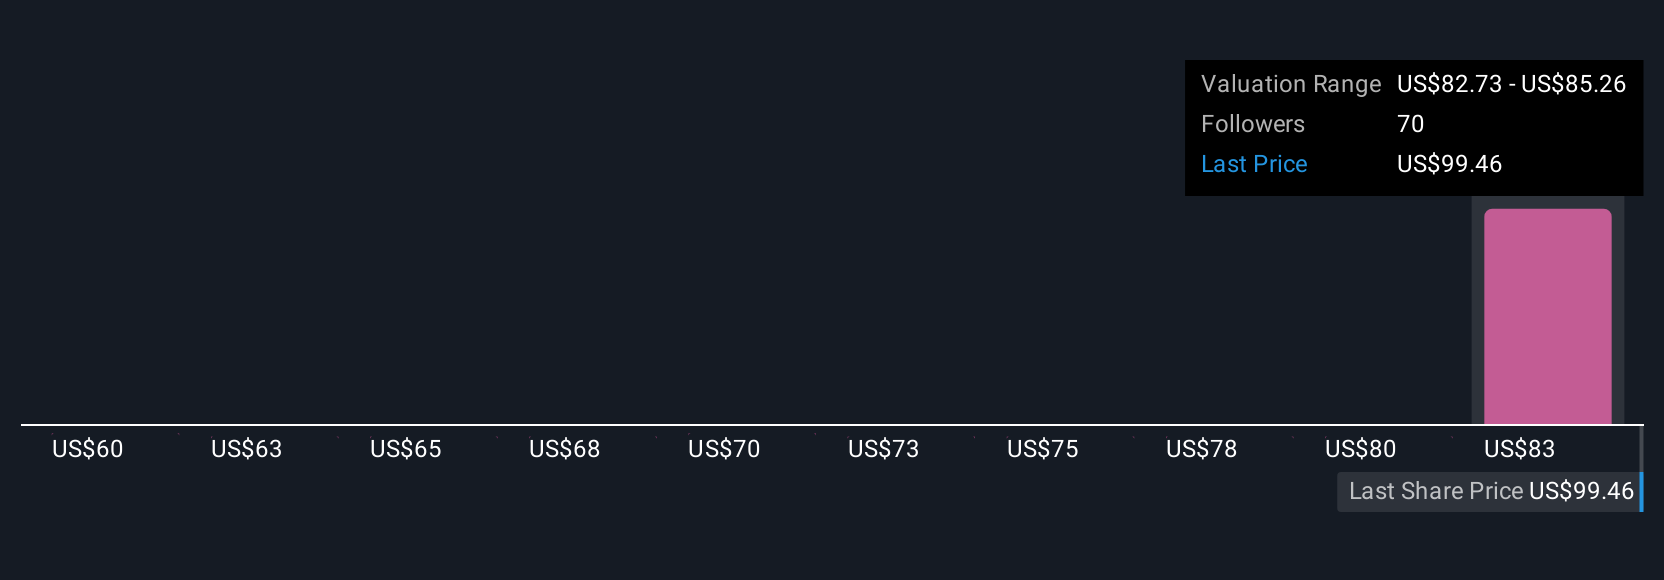
By comparing your Narrative’s fair value for Amphenol to the current price, you get a dynamic, personalized signal, especially since Narratives update automatically when fresh news or results surface. For example, Amphenol’s most optimistic investors currently set their fair value as high as $134 per share, while the most cautious see it closer to $85. This reflects how your own Narrative can shift with your beliefs about data center expansion, acquisition risk, or economic cycles. Narratives help you move beyond static ratios and empower smarter, story-driven investment decisions as the situation evolves.
Do you think there's more to the story for Amphenol? Create your own Narrative to let the Community know!
This article by Simply Wall St is general in nature. We provide commentary based on historical data and analyst forecasts only using an unbiased methodology and our articles are not intended to be financial advice. It does not constitute a recommendation to buy or sell any stock, and does not take account of your objectives, or your financial situation. We aim to bring you long-term focused analysis driven by fundamental data. Note that our analysis may not factor in the latest price-sensitive company announcements or qualitative material. Simply Wall St has no position in any stocks mentioned.
Have feedback on this article? Concerned about the content? Get in touch with us directly. Alternatively, email editorial-team@simplywallst.com